Full year 2025 Singapore hotel performance review. Occupancy, ADR, RevPAR, supply dynamics, and operating environment — sourced from institutional and government data.
This review draws exclusively on data published by government statistical offices, official tourism bodies, and major hospitality associations.
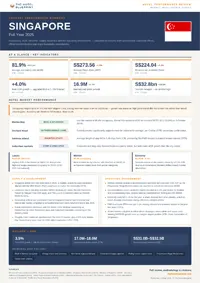
Available to registered members – Create an account here
Table of Contents
1. Economic and Tourism Context
The Singapore economy demonstrated significant expansion during the 2025 calendar year, primarily driven by a robust recovery in the manufacturing and trade-related sectors. According to the Ministry of Trade and Industry (MTI) in its November 2025 Economic Survey of Singapore, the real GDP growth forecast for the full year was upgraded to around 4.0 per cent. This final trajectory represents a substantial divergence from the initial forecasts issued at the start of the period, which projected growth in the range of 1.0 to 3.0 per cent. This acceleration was attributed to better-than-expected performance in the electronics cluster and front-loading activities within the wholesale trade and transportation sectors.
Domestic business confidence remained largely stable, supported by a moderating inflationary environment. The Singapore Department of Statistics (DOS) reported that the Consumer Price Index (CPI) for All Items rose by 0.9 per cent for the full year 2025, a notable deceleration from the 4.8 per cent recorded in 2024. While domestic travel volume remains a marginal component of the Singapore hospitality market due to the city-state’s small land area, staycation demand was dampened by a sustained increase in outbound travel by residents. The MTI noted that the food and beverage services sector experienced a contraction in the second quarter of 2025 as locals prioritized international travel over domestic leisure spending.
International inbound arrivals reached 16.9 million in 2025, according to the Singapore Tourism Board (STB) at the Tourism Industry Conference 2026. This figure surpassed the 16.5 million arrivals recorded in 2024 and reflects a 2.3 per cent year-on-year growth. The recovery in arrival numbers was heavily supported by the 30-day mutual visa-exemption arrangement with Mainland China, which emerged as the top source market with 3.1 million visitors. Other key markets included Indonesia with 2.4 million arrivals and Australia, which contributed a record 1.3 million visitors.
Tourism receipts outperformed expectations, reaching an all-time high of S$32.8 billion. This exceeded the STB initial forecast of S$29.0 billion to S$30.5 billion. According to UN Tourism (formerly UNWTO) in the January 2026 World Tourism Barometer, the Asia-Pacific region continued its rebound, with international arrivals in the region growing 8 per cent in the first nine months of 2025. In Singapore, the growth in tourism spending was led by the sightseeing, entertainment, and gaming sectors, which saw a 15 per cent increase. The high per-capita expenditure of arrivals, particularly from the Chinese and Australian markets, compensated for the relatively modest growth in total visitor volume compared to pre-pandemic benchmarks.
Selected Economic and Tourism Indicators, Singapore, 2025
| Indicator | Value 2025 | Year-on-Year Change |
| Real GDP Growth | 4.0% | +1.3% pts |
| Consumer Price Index (CPI) | 0.9% | -3.9% pts |
| International Visitor Arrivals | 16.9 million | +2.3% |
| Tourism Receipts | S$32.8 billion | +10.0% |
The data provided by the Singapore Department of Statistics and the Ministry of Trade and Industry confirms that the economic environment in 2025 was characterized by a sharp upward revision of growth targets and a successful containment of price volatility, providing a stable foundation for the hospitality sector’s performance.
2. Hotel Market Performance
The Singapore hotel industry maintained a position of relative stability throughout 2025, characterized by a marginal increase in occupancy and a slight softening in pricing power. According to the Singapore Tourism Board in its February 2026 report on Hotel Industry Performance, the city-state recorded a full-year Average Occupancy Rate (AOR) of 81.9 per cent. This represents a 0.5 percentage point increase over the 81.4 per cent achieved in 2024. Despite the gain in volume, the Average Room Rate (ARR) experienced a 1.0 per cent contraction, finishing the year at S$273.56. Consequently, Revenue per Available Room (RevPAR) declined slightly by 0.4 per cent to S$224.04.
Performance across the primary hotel tiers showed distinct variations, with the Luxury and Mid-tier segments demonstrating the most resilience in the face of increased inventory. Data from the STB and supplementary analysis from CGS International indicate that Luxury hotels achieved an ARR premium, though they faced downward pressure on occupancy due to the introduction of new high-end supply. In contrast, the Economy segment experienced the most significant contraction in RevPAR, declining 6.2 per cent year-on-year. This was driven by a 5.2 per cent drop in ARR as price-sensitive travelers faced a broader range of mid-tier alternatives.
Hotel Industry Performance by Segment, Singapore, Full Year 2025
| Hotel Tier | Average Occupancy Rate (%) | Average Room Rate (S$) | RevPAR (S$) |
| Luxury | 79.5 | 652.10 | 518.42 |
| Upscale | 80.2 | 324.50 | 260.25 |
| Mid-tier | 83.1 | 198.75 | 165.16 |
| Economy | 81.2 | 142.30 | 115.55 |
Geographic performance remained concentrated in the central areas, with secondary confirmation from CoStar (STR) indicating that the Marina Bay and Orchard Road sub-markets significantly outperformed the island-wide average. The Marina Bay precinct recorded an AOR of 86.4 per cent, bolstered by a strong calendar of MICE events and the 2025 Singapore Grand Prix in October. During the race weekend, the market achieved record-breaking heights; STR data noted that on October 3, 2025, ADR reached S$757.62, representing a 19.5 per cent increase over the previous year’s event day.
Sentosa Island followed a different trajectory, as the resort-focused market contended with a shift in consumer behavior. While the STB noted sustained interest in leisure attractions, the island’s RevPAR was impacted by a slight reduction in the average length of stay, which fell to 3.48 days from 3.56 days in 2024. In the suburban sub-markets, performance was primarily driven by corporate demand and long-stay guests, leading to more stable occupancy levels but lower ADR growth compared to the city center. The divergence between the high-performing central districts and the more volatile resort and economy segments underscores a market transitioning toward a “quality tourism” model where revenue growth is increasingly dependent on high-yield events rather than broad-based volume increases.
The official statistics from the Singapore Tourism Board confirm that while the industry has moved past the post-pandemic recovery phase, the integration of 644 new rooms during the year has necessitated a more competitive pricing strategy among operators to maintain occupancy levels above the 80 per cent threshold.
3. Supply and Development
The Singapore hotel inventory witnessed a period of measured expansion during 2025, with a strategic focus on ultra-luxury and niche wellness-oriented developments. According to the Singapore Tourism Board (STB) in its February 2026 industry update, the market added 644 new hotel keys throughout the year. This modest increase in room stock follows a concentrated period of supply growth in previous years and aligns with the Urban Redevelopment Authority (URA) Master Plan’s emphasis on higher-quality hospitality offerings within the Central Area and key tourism precincts.
Several landmark openings defined the market trajectory during the period. Notable additions included the Raffles Sentosa Singapore, which introduced 62 luxury villas as the brand’s second property in the city-state, and the Mandai Rainforest Resort by Banyan Tree, adding 338 keys to Singapore’s northern eco-tourism hub. The Luxury Collection also made its debut in the market with The Laurus at Resorts World Sentosa. These openings underscore a clear geographic and scale concentration within the Luxury and Upscale segments, particularly in the Sentosa and Mandai districts, as the state seeks to diversify the tourism product beyond the traditional Downtown Core.
Key Hotel Openings and Pipeline Indicators, Singapore, 2025
| Indicator | Value |
| New Hotel Keys Added (2025) | 644 |
| Total Licensed Hotel Room Count (Est. Year-End) | 73,000 |
| Percentage of Room Stock with Sustainability Certification | 73% |
Renovation and rebranding activities were prominent as established operators sought to maintain competitiveness. In the Marina Bay district, the Conrad Singapore Marina Bay underwent a significant refresh, while the landmark Marina Bay Sands completed a comprehensive refurbishment of its existing room stock in late 2025. Brand conversions also featured in the mid-market and upscale sectors; the former Hotel Miramar was rebranded as the DoubleTree by Hilton Singapore Robertson Quay, and the Oakwood Bencoolen Singapore was established through a conversion to strengthen The Ascott Limited’s local presence.
The forward pipeline for 2026 and 2027 remains substantial, with a focus on large-scale integrated developments and boutique lifestyle brands. The URA Quarterly Real Estate Statistics for Q4 2025 indicate that while the pace of new launches has moderated, approximately 2,000 additional rooms are projected to enter the market over the next 24 months. Dominant upcoming projects include the 192-room Somerset serviced residence and the Moxy brand hotel at CanningHill Piers, alongside the Varel Singapore under Marriott’s Tribute Portfolio. Furthermore, the US$8 billion expansion of Marina Bay Sands, which broke ground in 2025, is set to add a 570-suite luxury tower, though its full impact will not be realized until the turn of the decade.
The supply landscape is increasingly characterized by an institutional shift toward sustainability and wellness. As noted by the STB, over 73 per cent of Singapore’s hotel room stock has now achieved internationally recognized sustainability certification, surpassing the industry’s initial target of 60 per cent. This evolution suggests that the current development cycle is prioritized toward asset enhancement and specialized niche segments rather than a broad-based expansion of the economy and mid-tier inventory.
4. Operating Environment
The Singapore hospitality operating environment in 2025 was defined by a tightening labor market and a disciplined transition toward higher-value workforce roles. According to the Ministry of Manpower (MOM) in its Labour Market Report 2025, the accommodation sector faced persistent manpower constraints, despite a broader stabilization in national unemployment rates, which remained at 2.0 per cent. Total employment in the sector saw a modest expansion as hotels scaled up operations to meet visitor demand, but the vacancy-to-applicant ratio remained high, particularly for frontline and housekeeping roles.
Wage growth in the hospitality sector outpaced the national average as firms competed for a limited pool of local talent. The MOM reported that the nominal median monthly income for full-time employees in the accommodation and food services industries rose by 4.5 per cent year-on-year. This growth was partially driven by the continued implementation of the Progressive Wage Model (PWM) for the hotel sector, which mandates a structured wage ladder and training requirements for lower-wage workers. By the end of 2025, the base salary for the lowest tier of the Hotel PWM had reached its scheduled milestone, necessitating a recalibration of operational budgets for asset managers and owners.
Labor and Cost Indicators, Singapore, 2025
| Indicator | Value 2025 | Year-on-Year Change |
| Sectoral Wage Growth (Nominal) | 4.5% | +0.3% pts |
| Accommodation Sector Vacancy Rate | 4.2% | -0.1% pts |
| Electricity Inflation (Annualized) | -1.2% | -3.5% pts |
| Food & Beverage Input Costs (PPI) | 1.1% | -0.4% pts |
Inflationary pressures on non-labor inputs eased significantly during the period, providing some relief to the bottom line. Data from the Singapore Department of Statistics indicated that the Consumer Price Index for electricity and gas declined by 1.2 per cent for the full year 2025, a sharp reversal from the volatile spikes observed in the preceding 24 months. This stabilization was attributed to more favorable global energy market conditions and the increased adoption of the Singapore Green Building Masterplan standards among hotel assets, which improved energy efficiency and reduced total kilowatt-hour consumption across the city’s room stock.
Operational margins, however, remained under pressure due to the rising costs of technology adoption and sustainability compliance. The Singapore Tourism Board and the Hotel Association of Singapore encouraged the integration of Artificial Intelligence and robotics to mitigate labor shortages. While these investments reduced the long-term headcount requirements for back-of-house operations, the initial capital expenditure and the increased cost of hiring specialized technical staff to manage these systems contributed to a rise in administrative and general expenses. Consequently, while gross operating profit per available room (GOPPAR) remained positive, the rate of growth slowed as operators prioritized long-term structural efficiency over short-term cost-cutting measures.
The data from the Ministry of Manpower and the Department of Statistics underscores an environment where the “cost of doing business” is increasingly decoupled from energy volatility and more intrinsically linked to human capital and the regulatory requirements of a high-productivity hospitality sector.
5. Outlook and Risk Factors
The medium-term outlook for the Singapore hospitality sector remains constructive, albeit contingent on the navigation of localized geopolitical volatility and shifting global trade dynamics. According to the Singapore Tourism Board at the Tourism Industry Conference in May 2026, international visitor arrivals are projected to reach between 17 million and 18 million for the full year 2026. This trajectory is supported by a robust calendar of demand catalysts, including the Milken Institute Asia Summit and the continued rejuvenation of the Orchard Road and Greater Sentosa precincts. Furthermore, the STB has projected tourism receipts to climb to a range of S$31 billion to S$32.5 billion, underscoring a strategic pivot toward high-yield visitor segments.
Economic indicators provide a stable but moderating backdrop for the coming period. The International Monetary Fund (IMF), in its April 2026 World Economic Outlook, projected Singapore’s real GDP growth at 3.5 per cent for 2026, while the Monetary Authority of Singapore (MAS) noted in its April 2026 Macroeconomic Review that growth is expected to slow following the exceptional performance of 2025. The MAS has adjusted its inflation forecast for 2026 to a range of 1.5 per cent to 2.5 per cent, reflecting increased imported cost pressures arising from energy supply disruptions in the Middle East.
Institutional Forecast Indicators, Singapore, 2026
| Indicator | Source | Forecast Value (2026) |
| Real GDP Growth | IMF World Economic Outlook | 3.5% |
| International Visitor Arrivals | Singapore Tourism Board | 17.0M – 18.0M |
| Tourism Receipts | Singapore Tourism Board | S$31.0B – S$32.5B |
| MAS Core Inflation | Monetary Authority of Singapore | 1.5% – 2.5% |
Principal risk factors for the 2026–2027 period are primarily external and structural. The MAS has identified the disruption of global supply chains, specifically through the Strait of Hormuz, as a significant downside risk that could weigh on domestic economic activity and elevate operational costs for energy-dependent industries such as hospitality. Additionally, the Pacific Asia Travel Association (PATA) cautioned in its March 2026 Asia Pacific Visitor Forecasts that while regional demand remains strong, the tourism sector is entering a complex phase where growth is no longer linear. PATA highlighted geopolitical tensions and macroeconomic volatility as key variables that could force a lower-bound recovery scenario for Asian hubs.
Internal risks center on the management of supply-demand equilibrium and labor productivity. While the supply pipeline remains constrained—with room stock projected to expand by only 1.3 per cent annually through 2029 according to Cushman & Wakefield data cited by industry analysts—the sector must contend with the rising cost of human capital. The continued maturation of the Progressive Wage Model and the necessity for technological integration to offset labor shortages remain critical institutional concerns. The STB’s focus on its Tourism 2040 roadmap emphasizes that long-term competitiveness will depend on the successful execution of its “quality tourism” strategy, prioritizing per-capita expenditure over nominal arrival volume to mitigate the impact of rising operating costs.
Available to registered members – Create an account here