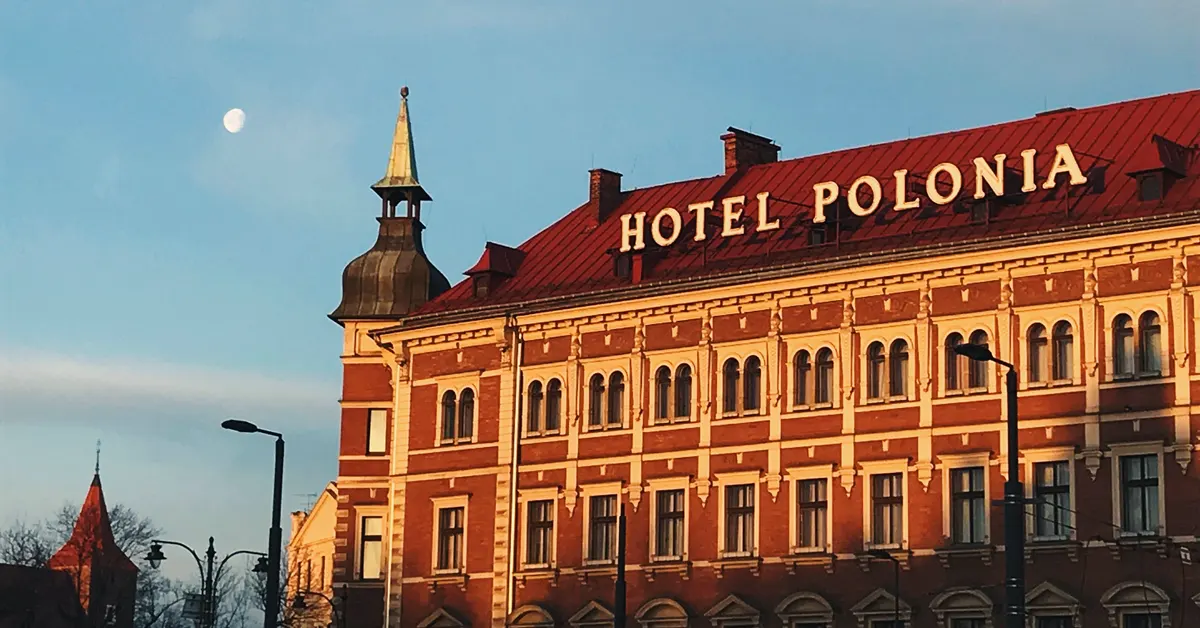
Full year 2025 Poland hotel performance review. Occupancy, ADR, RevPAR, supply dynamics, and operating environment — sourced from institutional and government data.
This review draws exclusively on data published by government statistical offices, official tourism bodies, and major hospitality associations. All sources are cited.
Available to registered members – Create an account here
Table of Contents
1. Economic and Tourism Context
Macroeconomic Performance and Indicators
According to the preliminary national accounts estimate released by Statistics Poland (GUS — Główny Urząd Statystyczny), the real gross domestic product of Poland expanded by 3.6 percent in 2025 compared with 2024. This outcome represents an acceleration in growth from the 3.0 percent expansion recorded during the prior year. The primary driver of this economic performance was domestic demand, which grew by 4.0 percent over the twelve-month period.
Household consumption expenditure increased by 3.7 percent, supported by a strong domestic labor market and growing real disposable income. Concurrently, gross fixed capital formation rose by 4.2 percent in 2025, rebounding from a 0.9 percent contraction in 2024. This investment growth was heavily supported by the absorption of European Union development funds and increased public expenditures.
The actual macroeconomic outcomes for 2025 aligned closely with the institutional forecasts published earlier in the fiscal cycle. In the Autumn 2025 European Economic Forecast released by the European Commission Directorate-General for Economic and Financial Affairs (DG ECFIN), real GDP growth was projected to settle at approximately 3.5 percent for the year, a figure that was slightly exceeded by the final 3.6 percent expansion reported in the official national accounts.
Domestic and International Tourism Volumes
The Polish tourist sector recorded a significant expansion in volume during 2025. Data published by Statistics Poland in its annual tourism release showed that a total of 44.9 million guests utilized registered tourist accommodation establishments during the year. This volume represents a 10.1 percent increase compared to the previous year. Within this total, domestic tourism continued to form the baseline of demand. Polish residents accounted for 65.0 million of the total 83.2 million tourist trips made by citizens during the year, representing a 5.5 percent increase in overall domestic mobility. This domestic activity translated into record travel-related spending by Polish residents, which increased by 10.4 percent year-on-year to reach PLN 119.5 billion.
International inbound traffic also experienced expansion during the period. Total foreign arrivals to the country reached 77.8 million in 2025, which represents a modest 1.1 percent increase over 2024. However, the segment of foreign arrivals classified as overnight tourists—those utilizing commercial or private lodging—expanded more rapidly, rising by 8.6 percent to reach 21.4 million individuals. The remaining 56.4 million arrivals were classified as same-day visitors, a category that contracted by 1.4 percent compared to the prior year.
Foreign visitors generated PLN 61.6 billion in total spending within the Polish economy during their stays. In terms of transportation channels, airport border traffic saw substantial expansion, with total passenger crossings growing to 61.1 million. This total included 23.4 million crossings by foreign nationals, which represents a 10.5 percent increase over the preceding year, further indicating the recovery of long-haul and regional air-bound tourism.
Geographic Distribution of Tourism
The distribution of overnight guests in accommodation establishments remained concentrated in specific regions. According to the regional databases of Statistics Poland, the largest volumes of overnight tourists were recorded in the Mazowieckie region with 7.7 million guests, the Małopolskie region with 6.7 million guests, and the Dolnośląskie region with 5.1 million guests. In terms of total overnight stays provided, the coastal region of Zachodniopomorskie led the market with 17.3 million overnight stays, followed closely by the southern mountain and cultural hub of Małopolskie at 17.0 million overnight stays, and the capital-dominated region of Mazowieckie at 12.5 million overnight stays.
Tourist Traffic and Spending in Poland
The following table presents the final annual tourism traffic metrics and associated visitor expenditures for the full year 2025 as published by Statistics Poland (GUS) in the June 2026 release of the “Tourism in 2025” report.
| Metric Category | Volume / Value (2025) | Year-on-Year Change (%) |
| Total Accommodation Guests | 44.9 million | +10.1% |
| Total Overnight Stays Provided | 111.7 million | +7.2% |
| Domestic Travel Spending | PLN 119.5 billion | +10.4% |
| Total Foreign Arrivals | 77.8 million | +1.1% |
| Overnight Foreign Tourists | 21.4 million | +8.6% |
| Foreign Visitor Expenditure | PLN 61.6 billion | +5.3% |
2. Hotel Market Performance
National Key Performance Indicators
The hotel market in Poland demonstrated sustained expansion throughout fiscal year 2025 (FY 2025). Official national data from Statistics Poland (GUS) indicate that 44.9 million tourists utilized accommodation establishments during the period, representing a 10.1% increase compared to the prior fiscal year. Total overnight stays reached 111.7 million, yielding a 7.2% year-on-year (y/y) increase. Bed occupancy rates in facilities containing ten or more beds reached 40.2% in FY 2025, up slightly from 40.1% in FY 2024.
Because official national statistics compiled by GUS do not track commercial financial metrics, sector-specific indicators such as average daily rate (ADR) and revenue per available room (RevPAR) must be evaluated using secondary commercial databases. According to market data from Cushman & Wakefield and BNP Paribas Real Estate, Poland recorded a 7.0% y/y increase in RevPAR during FY 2025. This momentum aligned with broader Central and Eastern Europe (CEE) trends, where the CEE-6 capital markets experienced an average RevPAR growth of 8.9% y/y, supported by a 4.6% expansion in ADR and a 2.7 percentage point rise in occupancy.
Regional and Segment Variations
Performance varied significantly across Poland’s primary metropolitan sub-markets, reflecting distinct demand drivers. The capital city of Warsaw served as a major engine of growth. Hotel room supply in Warsaw expanded by 5.5% y/y in FY 2025, marking the highest inventory growth rate among CEE capital cities. Despite this influx of new rooms, robust business and group demand absorbed the capacity, driving a 9.1% y/y increase in Warsaw’s RevPAR.
Krakow, representing the cultural and leisure hub of the Małopolskie region, recorded the strongest financial growth among major Polish cities, with RevPAR climbing 10.0% y/y. This performance was underpinned by a recovery in international arrivals. Nationwide, foreign tourist volumes reached 21.4 million in FY 2025, which is an 8.6% increase compared to FY 2024, with Małopolskie attracting a substantial share of these visitors.
Dolnośląskie, centered around Wroclaw, functioned as the third-largest sub-market by volume, supported by a mix of corporate travel and regional leisure. According to GUS regional data, tourist volumes concentrated heavily in these three primary hubs.
Tourist Arrivals in Accommodation Establishments by Selected Voivodship
| Voivodship | Tourists Accommodated (Millions) |
| Mazowieckie | 7.7 |
| Małopolskie | 6.7 |
| Dolnośląskie | 5.1 |
The data in the table above, sourced directly from the Statistics Poland FY 2025 annual tourism release, illustrates the geographic concentration of demand. Mazowieckie, encompassing Warsaw, registered the highest volume at 7.7 million accommodated guests, followed by Małopolskie at 6.7 million, and Dolnośląskie at 5.1 million.
3. Supply and Development
Current Supply Structure
According to the official database published by Statistics Poland (GUS) in its June 2026 “Tourism in 2025” report, the registered hospitality inventory of Poland reached 2,629 active hotels operating at the conclusion of 2025. Within the broader accommodation sector, which comprised 11,114 active establishments (including rooms for guests, holiday centers, and training-recreational facilities), hotels remained the dominant commercial lodging category.
The structural distribution of Poland’s hotel market continues to be characterized by a growing degree of brand penetration. The “Horwath HTL 2026 Poland Hotel & Chains Report” indicates that branded properties reached a penetration rate of 46 percent by room count. Of the active hotel stock, 532 properties were classified as chain hotels, managing a combined inventory of 74,138 rooms. This indicates that while the absolute number of unbranded, independent properties remains high, national and international chain brands control the majority of high-capacity and premium-tier rooms, focusing their portfolios within primary metropolitan centers.
Openings and Brand Conversions
The 2025 calendar year saw a strong expansion of the hotel supply across major urban markets. According to data tracked in the “Europe Hotel Construction Pipeline Trend Report” from Lodging Econometrics (LE), Poland was identified as the primary driver of development and expected room growth in the Central and Eastern Europe (CEE) region. New hotel additions during the period were dominated by select-service and lifestyle brands, alongside targeted upscale entries in primary destinations.
Major international hotel groups expanded their footprints through both new constructions and brand conversions, the latter reflecting a strategic shift toward asset-light expansion. In Kraków, the market received notable upscale additions, including the premium Destigo Hotels brand launching the 40-room luxury Experior Boutique Hotel on Szewska Street, and Focus Hotels S.A. expanding via rebranding, converting an existing property into the 75-room four-star Focus Hotel Premium Kraków. In Warsaw, Marriott International expanded its select-service footprint in the Wola district with the opening of the 263-room Moxy Warsaw City on Towarowa Street, reflecting the sustained demand for lifestyle hotel brands targeting younger travelers. Brand conversions remained a highly utilized route for operators in 2025, accounting for more than half of the active development pipeline for major international chains like Marriott International.
Pipeline Development
Looking ahead into the 12-to-24-month horizon, Poland’s development pipeline is positioned to remain highly active, with urban hubs and tourist centers dominating planned openings. According to pipeline projections tracked by Lodging Econometrics and CBRE, development activity is heavily concentrated in the upscale, upper upscale, and midscale segments.
Key projects scheduled for completion in 2026 and early 2027 include premium additions such as the 178-room Crowne Plaza Katowice, signed under a franchise agreement with Hotel & More to address growing corporate and convention demand in Silesia. Additionally, Marriott International’s pipeline features high-profile entries, including the scheduled opening of Le Méridien Kraków Royal, the Autograph Collection hotel in Wrocław, and a brand-new Renaissance property in the Old City of Gdańsk, further expanding premium chain penetration into the country’s primary secondary-city markets.
Branded Hotel Chain Penetration in Poland
The following table details the baseline structure of branded versus independent hotel properties in Poland at the transition from 2025 to 2026, as published in the “Horwath HTL 2026 Poland Hotel & Chains Report”.
| Hotel Classification | Total Active Properties | Total Room Inventory | Share of Room Market (%) |
| Branded / Chain Hotels | 532 | 74,138 | 46.0% |
| Independent Hotels | 2,097 | 87,025 | 54.0% |
| Total Polish Hotel Market | 2,629 | 161,163 | 100.0% |
4. Operating Environment
Labor Market Dynamics and Wage Growth
The Polish hospitality sector operated within a highly constrained labor environment throughout 2025. Data published by Statistics Poland (GUS — Główny Urząd Statystyczny) in its June 2026 release, “Average paid employment, wages and salaries in the national economy in 2025 – preliminary data,” confirms that total employment in the national economy remained flat at 11.04 million full-time equivalents.
Within this structural landscape, labor costs in the hospitality sector experienced significant upward pressure. The statutory minimum wage was raised to PLN 4,666.00 gross per month in January 2025, representing an 8.5 percent increase compared to the previous threshold. This regulatory adjustment directly elevated the wage floor across the sector, pulling up baseline wages for operational hotel roles such as housekeeping, front office, and food and beverage staff.
The preliminary annual figures for 2025 show that the average monthly gross wage in the national economy rose by 9.1 percent nominally to reach PLN 8,903.56. The NACE section designated as Accommodation and Catering (Zakwaterowanie i gastronomia) continued to record the lowest average salary of any monitored sector in the national economy. The average monthly gross wage in this category stood at PLN 5,990.92, which is 32.7 percent lower than the national economic average. This level represents a nominal increase of 8.6 percent compared to the FY 2024 final average of PLN 5,516.44, directly reflecting how minimum wage changes compression-forced upward salary adjustments across hotel payrolls.
Inflationary Pressures
The operational cost structure of hotels was shaped by broader macroeconomic inflation patterns. According to the Consumer Price Index (CPI) releases from Statistics Poland, consumer price growth moderated over the course of 2025 compared to the double-digit levels recorded in previous fiscal periods. In December 2025, the year-on-year inflation rate settled at 2.4 percent.
A sharp divergence persisted between the price movements of goods and services. The cost of goods rose by a modest 1.3 percent year-on-year in December 2025, whereas the cost of services expanded by 5.2 percent over the same period. This structural imbalance directly impacted hotel operators, as service-reliant supply chains, maintenance contracts, and outsourced operating services remained subject to elevated price pressures. Core inflation, which excludes food and energy prices, remained sticky, registered at 2.7 percent year-on-year in November 2025 by Narodowy Bank Polski (NBP), indicating that structural price pressures persisted within the domestic economy.
Energy Cost Trajectory
Energy overheads remained an area of elevated volatility and a primary driver of operating cost margins for Polish hotel properties during 2025. According to the communication issued by the President of Statistics Poland on January 15, 2026, the average annual consumer price index of energy carriers in 2025 increased by 7.5 percent compared to 2024. This expansion represents a significant acceleration in price growth from the 4.3 percent increase recorded during the 2024 calendar year.
The impact was reinforced by regional pricing dynamics compiled by Eurostat in its electricity price statistics for the second half of 2025. Adjusted for Purchasing Power Standards (PPS), electricity prices for consumers in Poland were among the highest in the European Union, standing at 37.15 PPS per 100 kWh—trailing only Romania and Czechia. The combination of accelerating energy carrier prices and high relative power costs placed a substantial burden on hotel operating margins, forcing properties to absorb higher utility expenses or attempt to pass these costs to consumers through elevated average daily rates.
Average Monthly Gross Wages in Poland (2025)
The following table details the comparative wage structure across key service sectors in the Polish national economy for the full year 2025, as published by Statistics Poland (GUS) in its June 2026 preliminary labor release.
| Economic Sector (PKD / NACE) | Average Monthly Gross Wage (PLN) | Divergence from National Average (%) |
| Information and Communication | 14,689.70 | +65.0% |
| National Economy Average | 8,903.56 | 0.0% |
| Accommodation and Catering | 5,990.92 | -32.7% |
5. Outlook and Risk Factors
Macroeconomic Projections
The performance of the Polish hotel market immediately following 2025 is projected to align with a transitional macroeconomic phase characterized by stabilizing domestic demand and shifting investment cycles. According to the July 2026 inflation and GDP projection published by Narodowy Bank Polski (NBP), the central bank of Poland, real GDP is forecast to expand by 3.7 percent in 2026 before moderating to 2.8 percent in 2027. This projection reflects a deceleration from the domestic consumption-led growth of 2025, as the growth rates of real wages and disposable household income slow down.
The primary engine of economic activity in 2026 is projected to shift toward gross fixed capital formation, which is forecast to accelerate to 7.1 percent growth, heavily supported by the peak absorption of European Union funds under the National Recovery Plan. However, the central bank projects a sharp contraction in investment growth to 1.6 percent in 2027 as this funding cycle winds down, which will subsequently constrain overall economic expansion.
In tandem with this growth trajectory, the central bank’s July 2026 projection revises the consumer price index (CPI) inflation path upward to 2.9 percent in 2026 and 2.7 percent in 2027, driven by persistent demand pressures and elevated import prices. The European Commission Directorate-General for Economic and Financial Affairs (DG ECFIN) Spring 2026 forecast presents a highly compatible trajectory, projecting Harmonised Index of Consumer Prices (HICP) inflation at 3.6 percent in 2026 due to the pass-through of energy commodity shocks, before moderating to 2.9 percent in 2027.
Sectoral Projections and Demand Catalysts
Medium-term structural demand for the tourism and hospitality sector is expected to remain positive, outstripping the growth rate of the wider economy. The World Travel & Tourism Council (WTTC) 2026 Economic Impact Research (EIR) for Europe projects that regional travel and tourism GDP will grow by 3.6 percent in 2026. In Poland, the economic contribution of the tourism sector is projected by WTTC to stabilize at approximately 4.4 percent to 5.0 percent of national GDP.
Operational data from the Polish Tourism Organisation (POT — Polska Organizacja Turystyczna) projects that international inbound arrivals will continue an upward trajectory, with a target of reaching 23.0 million overnight foreign visitors by the conclusion of 2026. This inbound expansion is expected to offset a projected deceleration in domestic leisure demand, as domestic consumer spending becomes increasingly constrained by elevated energy costs and a higher overall cost of living. Commercial corporate and MICE (Meetings, Incentives, Conferences, and Exhibitions) travel is expected to act as a key demand stabilizer, particularly in primary urban markets like Warsaw and Krakow, supported by the scheduled delivery of major infrastructure and commercial developments.
Documented Risk Factors
Institutional assessments identify three principal risk factors that threaten the stability of hospitality operating margins in Poland over the 2026–2027 horizon:
First, financing and debt-servicing costs are projected to remain elevated. The Monetary Policy Council (RPP — Rada Polityki Pieniężnej) of the NBP maintained the reference interest rate at 3.75 percent in mid-2026. Central bank assumptions indicate that interest rates will remain unchanged for the remainder of the year, prolonging the period of high capital costs for hotel operators holding variable-rate commercial debt or seeking refinancing for pipeline projects.
Second, labor market tightness is anticipated to persist, despite a projected nominal deceleration in national wage growth from 8.7 percent in 2025 to 6.4 percent in 2026 and 5.8 percent in 2027. The NBP projections note a structural demographic decline in the domestic labor supply, which maintains a low national unemployment rate of approximately 3.0 percent to 3.2 percent. This tight labor pool limits the ability of hotel operators to optimize staffing costs without risking service delivery quality.
Third, geopolitical instability in Eastern Europe and the Middle East remains a critical downside risk. The NBP explicitly documents that escalations in global conflicts present ongoing supply-side shocks, specifically maintaining upward pressure on global energy and commodity prices, which directly inflates utility overheads and limits the discretionary purchasing power of European travel consumers.
Macroeconomic Projection Indicators for Poland (2025–2027)
The following table details the key macroeconomic projection metrics for Poland, comparing the final estimated outcomes of 2025 with the central projections for 2026 and 2027 published by Narodowy Bank Polski in its July 2026 Inflation Report.
| Indicator Metric | FY 2025 (Actual/Estimate) | FY 2026 (Projection) | FY 2027 (Projection) |
| Real GDP Growth (y/y % change) | 3.6% | 3.7% | 2.8% |
| CPI Inflation (y/y average %) | 3.6% | 2.9% | 2.7% |
| Nominal Wage Growth (y/y % change) | 8.7% | 6.4% | 5.8% |
| Gross Fixed Capital Formation (y/y % change) | 4.4% | 7.1% | 1.6% |
Data Source
- Statistics Poland (GUS) — Gross Domestic Product in 2025: https://stat.gov.pl/en/topics/national-accounts/annual-national-accounts/gross-domestic-product-in-2025-preliminary-estimate,1,15.html
- Statistics Poland (GUS) — Tourism in 2025: https://stat.gov.pl/en/topics/tourism/tourism/tourism-in-2025,1,22.html
- Statistics Poland (GUS) — Average paid employment, wages and salaries in the national economy in 2025: https://stat.gov.pl/en/topics/labour-market/working-employed-wages-and-salaries-cost-of-labour/average-paid-employment-wages-and-salaries-in-the-national-economy-in-2025-preliminary-data,2,18.html
- Statistics Poland (GUS) — Consumer Price Index December 2025: https://stat.gov.pl/en/topics/prices-trade/price-indices/consumer-price-indices-in-december-2025,1,154.html
- European Commission (DG ECFIN) — European Economic Forecast, Autumn 2025 / Spring 2026: https://economy-finance.ec.europa.eu/economic-forecast-and-surveys/economic-forecasts_en
- Narodowy Bank Polski (NBP) — Inflation and GDP Projections (July 2026): https://nbp.pl/en/monetary-policy/inflation-reports/
- Eurostat — Electricity price statistics: https://ec.europa.eu/eurostat/statistics-explained/index.php?title=Electricity_price_statistics
- Cushman & Wakefield — Poland Hospitality Market Insights: https://www.cushmanwakefield.com/en/poland/insights
- BNP Paribas Real Estate — Poland Hotel Market Reports: https://www.realestate.bnpparibas.pl/market-reports
- Horwath HTL — Poland Hotel & Chains Report 2026: https://horwathhtl.com/publications/
- Lodging Econometrics (LE) — Europe Hotel Construction Pipeline Trend Report: https://lodgingeconometrics.com/portfolio/europe-hotel-construction-pipeline-trend-report/
- World Travel & Tourism Council (WTTC) — Economic Impact Research: Poland: https://wttc.org/research/economic-impact
Available to registered members – Create an account here