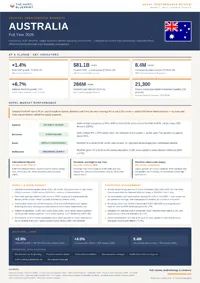
Full year 2025 Australia hotel performance review. Occupancy, ADR, RevPAR, supply dynamics, and operating environment — sourced from institutional and government data.
This review draws exclusively on data published by government statistical offices, official tourism bodies, and major hospitality associations.
Available to registered members – Create an account here
Table of Contents
1. Economic and Tourism Context
The Australian economy recorded real Gross Domestic Product (GDP) growth of 1.4% in chain volume terms for the 2024-25 financial year, according to the Australian Bureau of Statistics (ABS) Australian System of National Accounts. This outcome represented a marginal divergence from official forecasts; the Federal Budget Mid-Year Economic and Fiscal Outlook 2025-26 noted that while the recovery in the private sector strengthened, actual growth of 1.4% was lower than the 2.25% initially projected for the subsequent 2025-26 period. Nominal GDP rose by 1.8% over the same interval. National accounts data indicated that tourism’s contribution to the total economy remained stable, with tourism GDP accounting for 2.9% of total economic activity.
Consumer sentiment exhibited significant volatility throughout 2025. Data from the Melbourne Institute and Westpac Consumer Sentiment Index showed that confidence levels remained in negative territory for the majority of the year, reaching a low of -9.9 points in April 2025. However, a pivot in sentiment occurred in the fourth quarter, with the index rising to 3.8 points in November 2025. This recovery in confidence coincided with a rise in the household saving-to-income ratio, which increased to 6.1% from 3.0% in the previous year, suggesting a cautious but stabilizing domestic financial environment.
Domestic travel volume demonstrated resilience despite broader economic constraints. The ABS National Tourism Satellite Account 2024-25 reported that domestic overnight trips remained steady at 113 million. However, domestic day trips saw a substantial increase of 8% to 266 million. Total domestic tourism consumption rose by $1.2 billion in chain volume terms. Regional data from Destination NSW for the year ending December 2025 indicated that New South Wales alone received 39.2 million domestic overnight visitors, contributing to a broader upward trend in domestic expenditure which reached $45.4 billion nationally in the domestic sector.
International inbound arrivals continued a trajectory of recovery and growth during 2025. The ABS Overseas Arrivals and Departures series recorded 1.03 million short-term visitor arrivals in December 2025, a 9.7% increase compared to December 2024. For the full 2024-25 period, international visitor arrivals increased by 5% to reach 8.4 million. Tourism exports—representing expenditure by international visitors in Australia—rose by 10% to $42.3 billion. This growth was particularly pronounced in the education and recreational sectors, with international tourism consumption increasing by $2.6 billion in chain volume terms according to the Australian National Accounts.
National Tourism Indicators, Australia, 2024-25*
| Indicator | Unit | 2024-25 Value | Change on 2023-24 (%) |
| Tourism GDP (Current Prices) | $ billion | 81.1 | 3.8 |
| Tourism Consumption | $ billion | 211.1 | 3.4 |
| International Visitor Arrivals | million | 8.4 | 5.0 |
| Domestic Day Trips | million | 266.0 | 8.0 |
| Tourism Filled Jobs | number | 696,000 | 2.0 |
*Data sourced from the Australian Bureau of Statistics, Australian National Accounts: Tourism Satellite Account 2024-25, released in December 2025.
2. Hotel Market Performance
Australian hotel performance in 2025 was characterized by record-level Revenue Per Available Room (RevPAR) growth, driven by a sustained recovery in international arrivals and a resilient domestic events calendar. Data from Tourism Research Australia (TRA) for the year ending December 2025 indicates that hotels, resorts, and motels accounted for 28% of total visitor nights nationally. While the transition to the Domestic Tourism Statistics (DoTS) methodology in January 2025 requires cautious longitudinal comparison, TRA reports show that the volume of nights spent in commercial accommodation reached 46.4 million in the September quarter alone, representing 52% of all domestic nights away.
National RevPAR increased by 6.7% year-on-year, supported by significant gains in the primary gateway markets of Sydney and Perth. Primary data from the TRA September Quarter 2025 release confirms that while Australians remained cautious with discretionary spend, the commercial accommodation sector maintained a stable share of the travel market. Secondary confirmation from the CBRE Hotels Australia Overview and Outlook report indicates that national Average Daily Rate (ADR) and RevPAR have now moved entirely beyond pre-pandemic benchmarks, even as occupancy rates move toward a full cycle recovery.
Market performance exhibited marked geographic variation, with Sydney maintaining its position as the leading sub-market. According to data reported by Destination NSW via the CBRE Hotels 2025 analysis, Sydney recorded a national high occupancy rate of 83% for the full year. ADR in the Sydney market reached $334, a 5% increase over the preceding period, resulting in a record RevPAR of $279. This performance was underpinned by high-yield demand in the luxury and upscale segments, which aligned with the composition of recent inventory additions in the Sydney central business district.
Brisbane and Perth emerged as the strongest growth markets outside of New South Wales. In Brisbane, ADR increased by 9% year-on-year, positioning room rates 67% above 2019 levels—the highest percentage growth recorded among all major Australian capitals. Performance in Brisbane was bolstered by significant sporting fixtures, including the British and Irish Lions Tour, which pushed occupancy above 90% during peak intervals. Perth similarly achieved record results, with RevPAR reaching $199, a 9% year-on-year increase supported by a combination of corporate sector demand and a constrained supply pipeline. Melbourne recorded a more moderate 7% RevPAR growth to $183, as the market continued to absorb new room inventory delivered in the preceding twenty-four months.
Major Hotel Market Performance, Australia, 2025*
| Market | Occupancy (%) | ADR ($) | RevPAR ($) | RevPAR Change YoY (%) |
| Sydney | 83 | 334 | 279 | 9.0 |
| Melbourne | 76 | 241 | 183 | 7.0 |
| Brisbane | 79 | 262 | 207 | 11.0 |
| Perth | 78 | 255 | 199 | 9.0 |
| Adelaide | 77 | 218 | 168 | 5.0 |
*Data sourced from CBRE Hotels Australia Overview and Outlook 2025, published in March 2026, incorporating STR/CoStar benchmarking figures.
3. Supply and Development
The Australian hotel development cycle in 2025 transitioned into a phase of structural supply constraint, characterized by a marked deceleration in new completions relative to the preceding five-year average. According to the Tourism Research Australia Tourism Investment Monitor 2024-25, the national accommodation investment pipeline stood at $11.3 billion across 155 projects, representing a total potential addition of 21,300 rooms. However, the conversion of this pipeline into active supply was tempered by macroeconomic factors; the number of rooms in the pipeline decreased by approximately 2,400 compared to the 2023-24 period, reflecting a more cautious approach to new project commencements.
New hotel openings during 2025 totaled 2,034 rooms nationally. This volume represents a significant decline from the peak delivery years of the post-pandemic recovery, with new supply now entering the market at a rate approximately 41% below historical delivery levels. Secondary confirmation from the CBRE Hotels Australia Overview and Outlook 2026 report indicates that this slowdown is primarily driven by elevated construction costs—which Rawlinsons Australian Construction Handbook data shows increased by 25% to 45% between 2019 and 2025—alongside tighter financing conditions and labor shortages within the construction sector. Consequently, existing assets have frequently traded below replacement cost, disincentivizing new builds in several major sub-markets.
Geographic concentration of new supply remains centered on the eastern seaboard, although the volume of delivery varies significantly by city. In Melbourne, the market continued to absorb a substantial influx of inventory, with approximately 5,000 rooms added between early 2019 and early 2025—a 21% increase in total stock. In contrast, the Sydney market saw a more moderate expansion of 10.4% over the same period. For the 2025-26 window, the forward pipeline for Sydney is projected at 1,173 rooms, while Melbourne is expected to add a further 2,117 rooms. This divergence has led to differing occupancy recovery trajectories, as Melbourne navigates the integration of large-scale upscale and luxury additions.
Brand conversions and the dominance of upper-tier chain scales characterized the 2025 development landscape. Data from M3 Property indicates that 61% of recent completions were categorized as upper upscale or luxury. Major institutional activity included significant brand shifts, such as the acquisition and rebranding of Skye Suites Sydney by Furama Hotels International. The forward pipeline remains heavily weighted toward the premium sectors; of the ten largest projects currently under construction in the Melbourne market, seven are designated as upper upscale, totaling 1,627 rooms, whereas midscale additions account for fewer than 200 rooms. This trend indicates a strategic shift toward high-yield, luxury assets in the face of rising operational and capital costs.
Tourism Investment Pipeline by Sector, Australia, 2024-25*
| Sector | Value ($ billion) | Projects (n) | Rooms (n) |
| Accommodation | 11.3 | 155 | 21,300 |
| Arts, Recreation & Business | 29.0 | 184 | N/A |
| Aviation | 34.2 | 24 | N/A |
| Total Pipeline | 74.5 | 363 | 21,300 |
*Data sourced from Tourism Research Australia, Tourism Investment Monitor 2024–25, published in December 2025.
4. Operating Environment
The Australian hospitality operating environment in 2025 was defined by persistent upward pressure on structural costs, specifically within the labor and energy sectors. Data from the Australian Bureau of Statistics Wage Price Index (WPI) indicates that total hourly rates of pay for the private sector rose by 3.2% through the year to December 2025. This growth was influenced by the Fair Work Commission (FWC) Annual Wage Review 2024–25, which mandated a 3.5% increase to the National Minimum Wage and all minimum award wages, including the Hospitality Industry (General) Award, effective from 1 July 2025. This adjustment raised the National Minimum Wage to $24.95 per hour, directly impacting the primary cost base for select-service and full-service hotel operators.
Labor market tightness remained a critical constraint, despite a marginal easing in broader national unemployment. According to the ABS Labour Account, the accommodation and food services industry recorded a job vacancy rate of 3.3% in mid-2025, which is more than double the pre-pandemic average. The Jobs and Skills Australia (JSA) Jobs and Skills Report 2025 noted that while overall employment growth slowed to 1.1% by December, service industries continued to drive approximately 90% of total employment growth over the decade. The ratio of unemployed persons to job vacancies stood at 1.9, significantly below the historical norm of 4.0, maintaining intense competition for skilled labor in front-of-house and culinary roles.
Energy price volatility exerted significant pressure on hotel margins throughout the calendar year. The ABS Consumer Price Index (CPI) reported a 23.6% annual increase in electricity prices for the year ending September 2025. This surge was primarily attributed to the expiry of state-level energy bill relief programs and annual price reviews implemented in July 2025. While wholesale electricity prices in the National Electricity Market (NEM) saw a decline of 27% during the same period, retail and commercial rates remained elevated as legacy contracts were renegotiated at higher base levels. The housing and utilities component of the CPI, which includes energy, contributed 1.17 percentage points to the total annual inflation movement of 3.8% recorded in December 2025.
General inflationary trends showed signs of stabilization in the final quarter, yet core services inflation remained “sticky.” The ABS reported that trimmed mean inflation—the preferred measure of the Reserve Bank of Australia for underlying price pressure—was 3.3% in the 12 months to December 2025. While goods inflation fluctuated with global supply chain dynamics, services inflation was pushed higher by the rising cost of insurance, which increased by 2.5%, and education, which rose by 5.4%. These non-discretionary overheads, combined with a 4.9% increase in the alcohol and tobacco index, necessitated frequent menu and beverage pricing adjustments across hotel food and beverage outlets to preserve gross operating profit (GOP) margins.
Consumer Price Index, Australia, Annual Movement by Group, December 2025*
| Group | Annual Change (%) |
| All Groups CPI | 3.8 |
| Food and non-alcoholic beverages | 3.4 |
| Alcohol and tobacco | 4.9 |
| Housing (inc. Utilities) | 5.5 |
| Health | 3.6 |
| Recreation and culture | 4.4 |
| Education | 5.4 |
*Data sourced from the Australian Bureau of Statistics, Consumer Price Index, Australia, December 2025, published in January 2026.
5. Outlook and Risk Factors
The medium-term outlook for the Australian hotel sector is defined by a transition toward moderate, value-driven growth amidst a tightening macroeconomic environment. Institutional forecasts from the International Monetary Fund (IMF) World Economic Outlook, updated in April 2026, project Australia’s real GDP growth to reach 2.0% for the 2026 calendar year. This represents a downward revision from previous estimates, reflecting the impact of persistent services inflation and elevated borrowing costs on household consumption. The IMF anticipates consumer price growth will remain at 4.0% through 2026, a figure that exceeds the average for most advanced economies and suggests a prolonged period of high operational overheads for hotel assets.
Forward demand indicators remain positive, specifically within the international inbound sector. Tourism Research Australia (TRA) forecasts indicate that international visitor arrivals are projected to reach 10.9 million by 2030, with 2026 serving as a pivotal year for market stabilization. Tourism Australia reported in May 2026 that inbound arrivals reached 9.1 million in the year to March, a 10% year-on-year increase that restored 99% of pre-pandemic volumes. Growth is expected to be concentrated in luxury and long-stay segments, supported by a projected 15% jump in international visitor expenditure. However, the TRA notes that “net outbound travel”—the gap between Australians traveling overseas and inbound arrivals—will remain large, placing continued pressure on domestic overnight volumes as locals compete for international aviation capacity.
Specific demand catalysts for 2026 include a concentrated calendar of major trade and cultural events. The Australian Tourism Exchange (ATE), held in Adelaide in May 2026, serves as a primary institutional driver for long-term export partnerships. Furthermore, the resurgence of “Bleisure 2.0″—the integration of corporate travel with extended leisure stays—is identified by the Blue Mountains International Hotel Management School (BMIHMS) at Torrens University as a structural shift, with 76% of business travelers in the Asia-Pacific region planning to combine trips. This trend is expected to support occupancy levels in central business district (CBD) towers, provided operators can offer the technological infrastructure required for seamless remote work transitions.
Principal risk factors are categorized by institutional sources into geopolitical, inflationary, and environmental sectors. The Reserve Bank of Australia (RBA) Statement on Monetary Policy (May 2026) identifies ongoing conflict in the Middle East as a primary risk to global energy supply, with a baseline forecast that headline inflation will peak at 4.8% in the June quarter of 2026. This environment has led the RBA to increase the cash rate to 4.35%, with further tightening anticipated to mitigate rising inflation expectations. Additionally, institutional reports from the Aussie Corporate and CBRE Hotels highlight the risk of “green hushing,” where rigorous sustainability requirements become a net-positive mandate for guests, potentially alienating operators who fail to provide transparent, verifiable environmental impact metrics.
Economic and Tourism Forecasts, Australia, 2026–2027*
| Indicator | Source | 2026 Forecast | 2027 Forecast |
| Real GDP Growth (%) | IMF World Economic Outlook | 2.0 | 1.7 |
| Consumer Price Inflation (%) | IMF World Economic Outlook | 4.0 | 3.6 |
| Cash Rate Target (%) | RBA (Market Implied) | 4.7 | 4.3 |
| Unemployment Rate (%) | RBA Baseline Forecast | 4.4 | 4.6 |
| International Arrivals (m) | Tourism Research Australia | 9.4 | 9.9 |
*Data sourced from IMF World Economic Outlook (April 2026), RBA Statement on Monetary Policy (May 2026), and Tourism Research Australia Forecasts.
Available to registered members – Create an account here