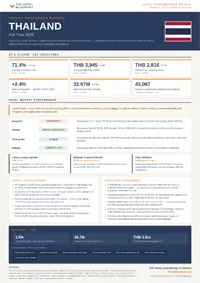
Full year 2025 Thailand hotel performance review. Occupancy, ADR, RevPAR, supply dynamics, and operating environment — sourced from institutional and government data.
This review draws exclusively on data published by government statistical offices, official tourism bodies, and major hospitality associations.
Available to registered members – Create an account here
Table of Contents
1. Economic and Tourism Context
The Thai economy recorded a real Gross Domestic Product (GDP) growth rate of 2.4% for the full year 2025, according to the National Economic and Social Development Council (NESDC). This performance represents a material acceleration from the 1.9% growth observed in 2024. The expansion was primarily supported by a 3.5% increase in the service sector and an 8.1% rise in gross fixed capital formation. Public investment increased by 13.3%, while private investment rose by 6.5%. This year-end result exceeded early-period institutional projections; the Ministry of Finance had previously anticipated growth of 1.8%, while the International Monetary Fund (IMF) had projected 2.1% in its November 2025 Article IV Consultation.
Domestic demand remained a primary driver of activity, though business and consumer sentiment faced volatility toward the end of the period. The Bank of Thailand (BoT) reported a Business Sentiment Index of 42.3 as of early 2026, reflecting caution following a period of geopolitical instability. The Consumer Confidence Index (CCI), monitored by the University of the Thai Chamber of Commerce (UTCC), declined to 51.9 in December 2025, down from 53.2 in November, as households responded to high living costs and political uncertainty.
International inbound arrivals reached 32,974,321 for the full year 2025, as reported by the Ministry of Tourism and Sports (MoTS). This figure marks a 7.23% contraction compared to the 35.55 million arrivals recorded in 2024. The decline was largely attributable to a significant reduction in the Chinese market, which saw a 33.55% year-on-year decrease to 4.47 million visitors. Conversely, the Malaysian market emerged as the primary source of volume with 4.52 million arrivals. Other key markets showed divergent trends: India grew by 16.82% to a record 2.49 million arrivals, and the Russian Federation increased by 8.80% to 1.90 million.
Domestic tourism demonstrated greater resilience than the international segment. Thai residents made 202.37 million domestic trips in 2025, an increase of 2.70% over the previous year. This domestic activity generated 1.17 trillion THB in revenue, representing a 3.69% increase. Total tourism revenue for the year, combining foreign and domestic spending, reached 2.70 trillion THB, a marginal decline of 1.26% from 2024.
Economic and Tourism Indicators: Thailand Full Year 2025*
| Indicator | Value 2025 | YoY Change (%) |
| Real GDP Growth | 2.4% | +0.5 pts |
| International Arrivals | 32,974,321 | -7.23% |
| Domestic Trips | 202,370,000 | +2.70% |
| Foreign Tourism Revenue | 1.54 tn THB | -4.71% |
| Domestic Tourism Revenue | 1.17 tn THB | +3.69% |
*The data above is sourced from the National Economic and Social Development Council (NESDC) and the Ministry of Tourism and Sports (MoTS) 2025 Annual Reports.
2. Hotel Market Performance
Thailand’s hotel sector experienced a divergence in performance metrics during 2025, characterized by a stabilization of occupancy levels and a sustained, albeit moderating, growth in Average Daily Rate (ADR). According to the Ministry of Tourism and Sports (MoTS), the national average occupancy rate for the full year 2025 stood at 71.4%, a marginal decrease from the 72.8% recorded in 2024. This contraction in occupancy coincided with the 7.23% decline in international arrivals noted in Chapter 1. Industry data from STR/CoStar (STR) corroborated this trend, reporting a 0.8% year-on-year decline in occupancy across its participating Thai portfolio, while noting that Revenue Per Available Room (RevPAR) remained essentially flat, increasing by only 0.2% due to rate-led growth.
The national ADR reached THB 3,945 in 2025, representing a 2.4% increase over 2024 figures. This growth was primarily driven by the luxury and upper-upscale segments, which maintained pricing power despite softer volume. Data from Knight Frank Thailand (KFT) indicates that luxury ADR in major markets rose by 7.8% year-on-year, significantly outperforming the broader market average. Consequently, the national RevPAR reached THB 2,816, a 1.1% increase compared to the prior period.
Regional Performance Variation
Geographic performance reflected a clear distinction between the capital and primary resort markets. Bangkok recorded a decline in average occupancy to 75.7%, a decrease of 3.1 percentage points from the 78.8% achieved in 2024. The softening of the Bangkok market was attributed to a combination of increased inventory and the decline in high-volume Chinese tour groups. Conversely, Phuket demonstrated significant resilience. The Phuket market recorded an average occupancy of 76.2% for the full year, with the first half of the year peaking at 79.5% and January reaching a high of 91.8%. Phuket’s ADR saw a substantial increase of 7.8% to THB 5,652, supported by strong demand for beachfront branded residences and luxury villas.
In Northern Thailand, Chiang Mai reported an average occupancy rate of 68.4%, remaining relatively stable compared to 2024. However, the region faced downward pressure on RevPAR during the mid-year period due to environmental factors and a slower recovery in regional short-haul demand. Performance in the Eastern Seaboard, specifically Pattaya, remained supported by domestic volume, maintaining an occupancy rate of 71.0% with a 6.3% increase in ADR.
Hotel Performance Metrics: Bangkok and Phuket Full Year 2025*
| Market | Occupancy (%) | ADR (THB) | RevPAR (THB) |
| Bangkok | 75.7% | 4,182 | 3,166 |
| Phuket | 76.2% | 5,652 | 4,307 |
*The data above is reproduced from the Knight Frank Thailand (KFT) “Bangkok & Phuket Hotel Market 2H 2025” research report and the Ministry of Tourism and Sports (MoTS) 2025 performance summary.
Segment-Level Performance
Performance by hotel class revealed that the Midscale and Upper-Midscale segments accounted for 47.6% of the total market share by room count. These segments faced the most significant competitive pressure, as consumer price sensitivity led to a marginal ADR decline of 1.4% in city-center properties. In contrast, the luxury segment expanded its market share and achieved the fastest growth in room yields. According to Mordor Intelligence, luxury accommodations in Thailand are projected to maintain a 10.8% CAGR in market value through the end of the decade, a trend supported by the 2025 performance data showing a clear shift toward high-yield, low-volume guest profiles.
3. Supply and Development
Thailand’s hotel construction pipeline reached a record volume by the conclusion of 2025, driven by a concentration of high-end developments in primary urban and resort nodes. According to the Construction Pipeline Trend Report from Lodging Econometrics (LE), Thailand concluded the fourth quarter of 2025 with 167 projects totaling 43,067 rooms. This development volume positions Thailand as the fifth-largest pipeline in the Asia Pacific region, excluding China. The surge in activity is characterized by a significant tilt toward higher chain scales, with luxury, upper-upscale, and upscale projects dominating the future inventory.
In the capital, supply expansion remains at the forefront of regional development activity. Bangkok led all markets in the Asia Pacific (excluding China) with 68 projects totaling 16,641 rooms. During 2025, 14 new hotels opened in Bangkok, adding 3,272 keys to the market. Notable completions included the Grande Centre Point Lumphini (512 keys) and the Andaz One Bangkok (244 keys). This influx of inventory has contributed to the moderating occupancy rates noted in Chapter 2, as the pace of supply growth has periodically outstripped the recovery of specific international demand segments.
Phuket remains the second-most active development hub in Thailand, finishing 2025 with 41 projects and 9,583 rooms in the pipeline. The resort market saw approximately 2,134 new keys introduced during the year. The development landscape in Phuket is increasingly defined by branded residences and luxury lifestyle properties, reflecting a strategic shift by developers toward high-yield assets that capitalize on the island’s resilient ADR performance.
Hotel Construction Pipeline by City: Thailand Q4 2025*
| City | Project Count | Room Count |
| Bangkok | 68 | 16,641 |
| Phuket | 41 | 9,583 |
| Other Regions | 58 | 16,843 |
*The data above is sourced from the Lodging Econometrics (LE) “Asia Pacific Hotel Development Trends & Projections – Winter 2025/26.”
Beyond new builds, brand conversions and renovations emerged as a critical component of supply dynamics in 2025. Institutional owners increasingly favored the rebranding of existing assets to leverage international distribution systems. A prominent example includes the announcement of the Fairmont Bangkok Sukhumvit, a 419-key rebranding project scheduled for the following 12-month cycle. Forward-looking data for 2026 suggests an intensification of this trend, with 16 properties totaling 3,738 keys scheduled to open in Bangkok alone.
Market concentration remains high, with independent hotels still accounting for 57.65% of the total hospitality market share in 2025, according to Mordor Intelligence. However, chain-affiliated properties recorded faster growth, expanding at a rate of 9.66% as developers prioritize the risk-mitigation benefits of global brand partnerships. Geographically, Bangkok and the Central Plains held 39.66% of the national market share by value, while Eastern Thailand is projected to see the most rapid supply-side growth over the next 24 months, supported by industrial development in the Eastern Economic Corridor (EEC).
4. Operating Environment
The operating environment for Thailand’s hospitality sector in 2025 was defined by significant regulatory shifts in labor costs and a persistently low-inflation macroeconomic backdrop. According to the National Statistical Office (NSO), the hospitality and food service sector remained a primary driver of non-agricultural employment growth. In the first quarter of 2025, employment in this sector expanded by 3.5% year-on-year, even as total national employment saw a marginal 0.5% contraction. The NSO recorded a national unemployment rate of 0.88%, a decrease from 1.01% in the prior period, indicating a tightening labor market that heightened competition for skilled service personnel.
Labor costs underwent a structural increase following the Wage Committee’s Notification (No. 14), published in the Royal Gazette. Effective 1 July 2025, a new daily minimum wage of THB 400 was mandated nationwide specifically for hotel businesses classified as Type 2, 3, or 4 under the Hotel Act (properties with more than 50 rooms or those offering dining and entertainment facilities). This regulatory adjustment represented a significant increase for operators in secondary provinces, where the previous daily minimum ranged from THB 337 to THB 359. In the Bangkok Metropolitan Area, the THB 400 rate was applied across all sectors, effectively institutionalizing a higher wage floor for the capital’s hospitality workforce.
Inflation and Commodity Prices
Headline inflation in Thailand remained subdued throughout 2025. The Bank of Thailand Monetary Policy Report (Q4 2025) projected headline inflation at 0.0% for the full year, primarily driven by supply-side factors including declining global crude oil prices and domestic retail fuel price subsidies. Core inflation, which excludes volatile food and energy prices, was recorded at 0.9%. While low inflation generally limits the escalation of procurement costs for food and beverage operations, the BoT noted that persistent low inflation reflected weak domestic demand and structural economic impediments rather than purely price stability.
Energy costs, a critical overhead for hotel operations, remained relatively stable due to government intervention. The Energy Regulatory Commission (ERC) maintained the average power tariff at THB 4.18 per kilowatt-hour (kWh) for the early part of the year, before implementing minor adjustments. By September 2025, the business electricity price was recorded at THB 4.086 per kWh. The ERC utilized clawback funds and fuel tariff (Ft) subsidies to mitigate the impact of global energy market volatility on commercial users, providing a degree of cost predictability for high-consumption assets such as luxury resorts and large-scale urban hotels.
Thailand Minimum Daily Wage Rates: Effective 1 July 2025*
| Category / Region | Daily Wage (THB) | Change Status |
| Hotel Business (Type 2, 3, 4) Nationwide | 400 | New Mandate |
| Bangkok Metropolitan Area | 400 | Institutionalized |
| Phuket, Chonburi, Rayong | 400 | Sustained |
| Mueang Chiang Mai District | 380 | Selective Increase |
*The data above is sourced from the Wage Committee Notification (No. 14), Ministry of Labour, and the Royal Thai Government Gazette.
Despite the stability in energy and raw material costs, the hospitality sector faced pressure from a 4.5% average salary increase across the broader Thai economy, as reported in the Deloitte Thailand Salary Policies Survey 2025. This wage growth, while lower than the historical 5.0% average, highlights the ongoing challenge for hotel operators to manage payroll margins in an environment where regulatory minimums and professional salary expectations are ascending.
5. Outlook and Risk Factors
The performance outlook for Thailand’s hospitality sector in 2026 is characterized by a strategic pivot toward value-led growth, amidst a moderating macroeconomic environment. The Tourism Authority of Thailand has established a revenue target of THB 3.0 trillion for 2026 under the “Amazing Thailand Squared” roadmap. This framework anticipates a recovery in international volume to 36.7 million arrivals, representing an 11% increase over the 2025 year-end result. The TAT strategy explicitly prioritizes high-value segments, including medical and wellness tourism, through the “Healing is the New Luxury” campaign, alongside an expansion into the nighttime economy and sub-culture markets such as sports and yachting.
Macroeconomic projections suggest a period of transition. The Bank of Thailand (BoT) and the International Monetary Fund (IMF) have converged on a real GDP growth forecast of 1.5% for 2026. This deceleration from the 2.4% recorded in 2025 is attributed to the dissipation of prior fiscal stimulus effects and the impact of elevated global geopolitical tensions on business costs and household purchasing power. Furthermore, the BoT’s Monetary Policy Committee maintained the policy rate at 1.00% in early 2026 to support the slowing economy, noting that headline inflation is expected to accelerate throughout the year due to supply-side pressures.
Principal Risk Factors
Institutional assessments identify three primary risks to the 2026 hospitality outlook:
- Geopolitical and Macro-Financial Volatility: The BoT Financial Stability Report identifies the ongoing conflict in the Middle East as a direct threat to growth via increased operating costs and eroded consumer confidence. The IMF notes that Thailand’s high level of household debt remains a structural vulnerability that could constrain domestic tourism spending if interest rates or living costs rise further.
- Segmented Market Recovery: While long-haul markets from Europe and North America reached record highs in late 2025, the contraction of the Chinese market—noted at -33.55% in Chapter 1—remains a critical volume risk. Institutional forecasts from Finansia suggest that while Chinese demand may turn positive by the second quarter of 2026, the recovery remains non-linear and sensitive to China-Japan geopolitical tensions.
- Climate and Environmental Disruptions: The Pacific Asia Travel Association (PATA) 2026-2028 Forecast flags climate-related disruptions as a systemic risk for Southeast Asian destinations. In Thailand, this manifests as seasonal environmental issues in Northern sub-markets and the increasing operational necessity for sustainable resource management in resort nodes.
Tourism Targets and Forecasts: Thailand 2026*
| Metric | 2026 Target/Forecast |
| Total Tourism Revenue | THB 3.0 Trillion |
| International Arrivals | 36.7 Million |
| Domestic Trips | 210.0 Million |
| Real GDP Growth | 1.5% |
| Foreign Revenue Growth | +7.0% (YoY) |
*The data above is synthesized from the Tourism Authority of Thailand (TAT) 2026 Strategic Plan, the Bank of Thailand (BoT) Monetary Policy Committee Decision 2/2026, and the IMF World Economic Outlook (April 2026).
Domestic tourism is projected to remain a vital demand buffer. The TAT targets 210 million domestic trips in 2026, generating THB 1.0 trillion in revenue. This 4% growth forecast is supported by the “Holistic Travel” concept, aimed at distributing demand to secondary provinces. However, the realization of these targets depends on the effective mitigation of the “higher-for-longer” cost environment facing both operators and travelers.
Available to registered members – Create an account here