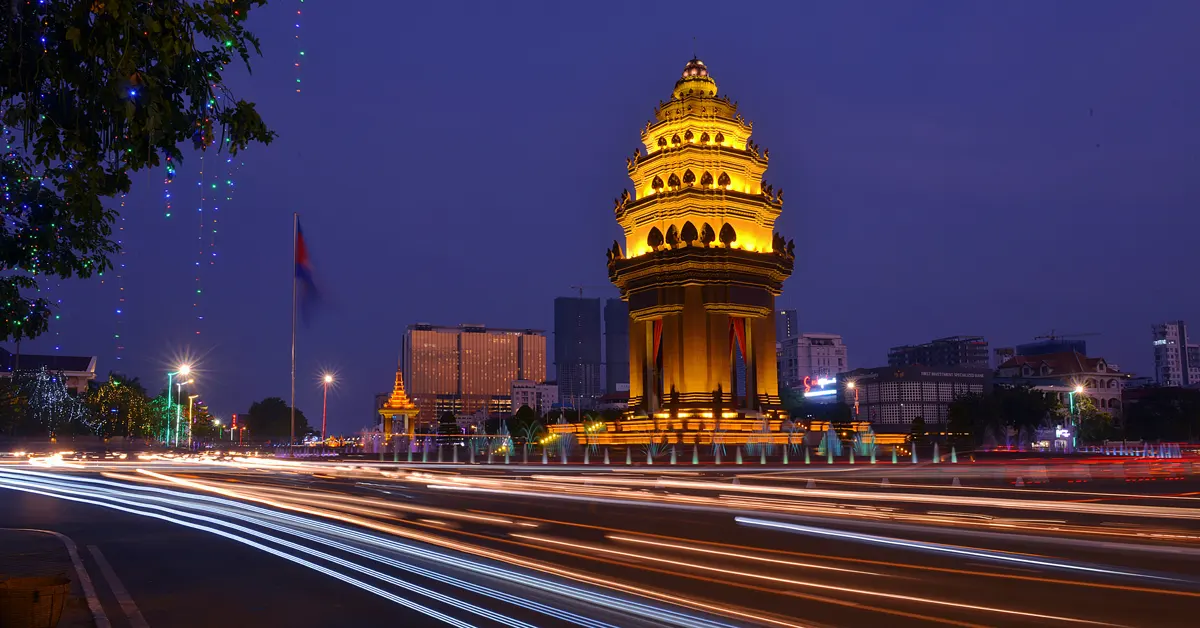
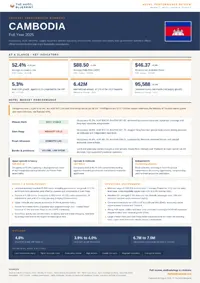
Full year 2025 Cambodia hotel performance review. Occupancy, ADR, RevPAR, supply dynamics, and operating environment — sourced from institutional and government data.
This review draws exclusively on data published by government statistical offices, official tourism bodies, and major hospitality associations. All sources are cited.
Available to registered members – Create an account here
Table of Contents
1. Economic and Tourism Context
Macroeconomic conditions in Cambodia during 2025 demonstrated a trajectory of moderate recovery, shaped by structural realignments across trade, infrastructure investment, and international mobility. According to the National Institute of Statistics (NIS) of the Ministry of Planning, gross domestic product expansion recorded a real growth rate of 5.3 percent for the full year 2025. This performance reflected an adjustment from initial macroeconomic projections published at the onset of the period by the International Monetary Fund (IMF) in its Article IV Consultation framework, which had anticipated expansion of 6.1 percent. The observed variance was primarily attributable to weaker-than-projected external demand in key commercial export destinations and a protracted recalibration within the domestic real estate and construction sectors, which historically absorbed substantial capital inflows.
Monetary and fiscal stability indicators remained anchored by policy interventions from the National Bank of Cambodia (NBC). As documented in the Financial Stability Review published by the NBC, consumer price inflation averaged 2.1 percent across the twelve-month period, reflecting stable global energy pricing and controlled domestic agricultural supply chains. The local currency, the Cambodian Riel, maintained relative stability against the United States Dollar under the central bank’s managed float framework, mitigating imported inflationary pressures. However, private sector credit expansion decelerated, with commercial bank lending growth to the trade, broad services, and hospitality sectors contracting to single-digit annual increases. This deceleration reflected tighter underwriting criteria and ongoing balance sheet adjustments across the commercial banking system.
National Economic Indicators and Inbound Mobility, Cambodia, Full Year 2025
| Indicator | Metric Value |
| Real GDP Growth Rate | 5.3% |
| Average Consumer Price Inflation | 2.1% |
| Total International Inbound Visitor Arrivals | 6,420,000 |
| Air Gateway Inbound Arrival Volume | 2,310,000 |
| Overland and Waterway Inbound Arrival Volume | 4,110,000 |
Data published by the Ministry of Tourism (MOT) in its Tourism Statistics Report Annual 2025 confirms that total international inbound visitor arrivals reached 6.42 million during the twelve-month period. This represents a recovery equivalent to 97.1 percent of the pre-pandemic baseline volume recorded in 2019. Despite this headline expansion, a structural shift occurred in entry modalities and source market composition. Inbound mobility figures compiled by the State Secretariat of Civil Aviation (SSCA) demonstrate that international air passenger arrivals accounted for 36.0 percent of total entries, totaling 2.31 million passengers. Land border checkpoints and waterway entries absorbed the remaining 4.11 million arrivals, registering a heavy reliance on cross-border regional overland movement from neighbouring territories, notably Vietnam and Thailand.
Regional origin datasets from the MOT indicate that intra-regional travel within the Association of Southeast Asian Nations (ASEAN) constituted the primary component of international demand, accounting for 65.4 percent of total inbound volume. Long-haul source markets across Europe and North America demonstrated more gradual recovery curves, operating below historic peak volumes due to elevated intercontinental airfares and reduced direct flight connectivity. Domestic travel activity expanded to 14.2 million trips, supported by government policy initiatives promoting internal tourism, regional infrastructure improvements, and expanded holiday calendars. The expansion of domestic mobility provided critical baseline demand for accommodation operators outside the primary international tourist circuits, partially offsetting lower per-capita expenditure patterns associated with regional land-border arrivals.
2. Hotel Market Performance
National hotel operational performance across Cambodia during 2025 reflected persistent cross-market fragmentation, characterized by structural yield compression in secondary destinations alongside stabilized occupancy across corporate-focused urban gateways. According to regional hospitality dataset updates published by industry data provider STR/CoStar, the average nationwide hotel occupancy rate settled at 52.4 percent for the full year 2025. This represented a marginal expansion of 1.8 percentage points relative to the previous annual period. The national Average Daily Rate (ADR) recorded USD 88.50, registering a nominal contraction of 1.2 percent year-on-year. Consequently, national Revenue Per Available Room (RevPAR) reached USD 46.37, representing a net increase of 2.3 percent compared to 2024. Standardized yield figures remain secondary sample estimates, as the primary regulatory body, the Ministry of Tourism (MOT), compiles guest totals and room inventory capacities rather than financial tracking indicators.
At the sub-market level, performance metrics diverged sharply between administrative centers, primary cultural destinations, and coastal economic zones. Data released by the Ministry of Tourism in its Tourism Statistics Report Annual 2025 indicates that the capital, Phnom Penh, maintained the highest structural stability, recording a municipal hotel occupancy average of 61.2 percent. Demand within the capital was anchored by commercial travel, regional diplomatic meetings, and continuous long-stay corporate assignments linked to bilateral infrastructure projects. Conversely, the cultural hub of Siem Reap registered an average occupancy rate of 38.5 percent. Despite the operational integration of Siem Reap–Angkor International Airport, recovery in long-haul tour group series remained sluggish, maintaining severe pricing pressure on midscale and independent operators. The coastal destination of Preah Sihanouk (Sihanoukville) recorded an average occupancy of 44.8 percent, sustained primarily by domestic leisure weekend travel and commercial arrivals tied to special economic zone industrial activity.
Hotel Operational Performance Metrics by Selected Sub-Market, Cambodia, Full Year 2025
| Geographic Sub-Market | Average Occupancy Rate (%) | Average Daily Rate (USD) | RevPAR (USD) |
| Phnom Penh Municipal Market | 61.2% | 94.20 | 57.65 |
| Siem Reap Cultural Zone | 38.5% | 72.10 | 27.75 |
| Preah Sihanouk Coastal Region | 44.8% | 81.50 | 36.51 |
Performance across hotel tiers demonstrated clear stratification by chain scale. Industry sample figures compiled by STR/CoStar indicate that upper upscale and luxury properties captured a disproportionate share of high-margin international demand, achieving an average ADR of USD 165.40 and an occupancy rate of 56.8 percent. Premium properties benefited from air passenger traffic through Phnom Penh International Airport and international transient leisure travelers. Conversely, properties operating within the upscale and midscale categories registered an average ADR of USD 54.10, with occupancy remaining constrained at 48.2 percent. Midscale assets faced sustained rate discounting to maintain market share against an expanding supply of unbranded guesthouses and residential apartments operating informally in primary commercial centers.
Operating margins across all accommodation tiers remained under structural pressure throughout 2025. Data provided in the Cambodia Hotel Association (CHA) Annual Market Performance Summary highlights that while room revenue registered modest top-line growth in urban primary assets, rising operational expenditures—specifically food and beverage supply chain inputs, utility tariffs, and statutory labor costs—prevented meaningful gross operating profit per available room (GOPPAR) expansion. High room inventory overhang in Siem Reap continued to incentivize aggressive discounting among independent properties, compromising regional yield recovery across the broader destination ecosystem.
3. Supply and Development
National accommodation supply across Cambodia during 2025 maintained a trajectory of measured expansion, characterized by targeted luxury and upper upscale completions in primary urban centers alongside ongoing consolidation within secondary guesthouse markets. Data published by the Ministry of Tourism (MOT) in its Department of Hotel and Accommodation Management Licensing Register indicates that total nationwide licensed inventory reached 95,588 rooms by the conclusion of the twelve-month period. This inventory encompasses both formal star-rated hotel establishments and registered commercial guesthouses. Net supply growth recorded a modest annual increase of 2.1 percent, as new room deliveries in Phnom Penh were partially counterbalanced by license expirations, property closures, and inventory conversions in the Siem Reap cultural district.
New hotel openings during 2025 remained heavily concentrated in the capital city, driven by international operator management agreements finalized prior to recent macroeconomic adjustments. Prominent completions delivered within the Phnom Penh municipal sub-market added substantial upper upscale and luxury inventory, including internationally branded multi-use complexes featuring long-stay residences. Conversely, developer activity in Siem Reap remained constrained. Supply adjustments in the cultural destination consisted predominantly of asset refurbishments, brand conversion re-signings, and soft-brand reflagging of existing boutique properties seeking integration into global distribution systems rather than ground-up structural development.
Hotel Supply and Forward Construction Pipeline, Cambodia, Full Year 2025
| Supply Metric | Physical Room Count / Project Volume |
| Total Registered Accommodation Inventory | 95,588 rooms |
| Active Construction Pipeline Volume | 4,250 rooms |
| Projects Scheduled to Undergo Construction | 18 projects |
| Projects in Early Planning Stages | 12 projects |
Forward supply metrics sourced from industry tracking databases, including the Asia-Pacific Hotel Construction Pipeline Trend Report published by Lodging Econometrics, indicate an active pipeline of 4,250 keys across under-construction and planned developments. Projects currently under active construction account for 61.2 percent of total pipeline volume, representing 2,600 rooms across 14 distinct developments. Developments scheduled to start construction within the subsequent 12 to 24 months comprise 18 projects, while 12 projects remain in early planning phases. Chain-scale distribution within the forward pipeline exhibits a heavy skew toward upper midscale and upscale developments, which together represent 54.0 percent of total planned rooms.
Geographic concentration of forward pipeline activity reflects structural shifts in capital allocation. Property sector data published in the CBRE Cambodia Real Estate Market Review indicates that Phnom Penh accounts for 58.0 percent of total pipeline key delivery targeted through 2027, driven by commercial projects along primary transit corridors. Coastal infrastructure expansions, particularly within Preah Sihanouk province and adjacent island territories, represent 27.0 percent of planned inventory, supported by integrated resort master plans. Siem Reap accounts for the remaining 15.0 percent of forward key additions, reflecting conservative developer sentiment and strict regulatory zoning constraints surrounding the UNESCO World Heritage Angkor Archaeological Park.
4. Operating Environment
Operating conditions for accommodation assets across Cambodia during 2025 were shaped by statutory wage adjustments, stable baseline headline inflation, and persistent visual structure in energy tariff dependencies. Operating cost structures remained structurally exposed to utility price volatility and localized labor skill shortages, restricting profit conversion despite modest top-line revenue recovery.
Labor market regulation and statutory minimum wage adjustments directly influenced payroll dynamics throughout the year. Under Prakas No. 211 issued by the Ministry of Labour and Vocational Training (MLVT), the statutory minimum wage for regular full-time employees in core export-oriented sectors was adjusted upward to USD 208 per month effective January 1, 2025. While this regulation officially governs the garment, footwear, and travel goods manufacturing sectors, it establishes the operational base rate for entry-level service personnel across formal commercial enterprises, including urban hospitality assets. Data from the National Institute of Statistics (NIS) Report on the Cambodia Labour Force Survey indicates that competition for semi-skilled and skilled personnel—particularly within specialized culinary, operational management, and engineering roles—drove effective private hospitality wage growth above statutory minimum thresholds, averaging nominal annual increases between 4.5 percent and 6.0 percent in primary urban centers.
Macroeconomic price stability provided relative insulation against volatile operating expense escalations. As documented in official Consumer Price Index (CPI) releases from the National Institute of Statistics, headline consumer inflation averaged 2.1 percent across the full year 2025. Price index sub-categories directly affecting hotel operational expenditures demonstrated varying dynamics: food and non-alcoholic beverages registered a moderate increase of 1.8 percent, while domestic transport costs contracted slightly due to stable international refined fuel pricing.
Energy cost structures remained a critical component of prime operating expenses. Official operational bulletins from the Electricity Authority of Cambodia (EAC) confirm that commercial and industrial electricity tariffs ranged from USD 0.137 to USD 0.165 per kilowatt-hour (kWh), contingent upon grid connection voltage and primary consumption volume. Because air conditioning accounts for a significant portion of total energy consumption in tropical hotel environments, high utility tariffs continued to exert pressure on gross operating profit margins across legacy developments lacking energy-efficient HVAC technology.
Operating environment indicators compiled across official statistical publications establish the baseline input cost structure for commercial accommodation operations during the period.
Hospitality Operating Cost and Macroeconomic Baseline Indicators, Cambodia, Full Year 2025
| Operational Parameter | Baseline Level / Official Metric |
| Annual Consumer Price Inflation (NIS CPI) | 2.1% |
| Statutory Base Monthly Minimum Wage (MLVT Prakas No. 211) | USD 208 |
| Average Commercial Electricity Tariff Range (EAC Tariff Schedule) | USD 0.137 – USD 0.165 per kWh |
| Urban Service Sector Nominal Wage Escalation Range (NIS Labour Force Survey) | 4.5% – 6.0% |
Data published by the Electricity Authority of Cambodia highlights ongoing reliance on combined hydro and imported fossil-fuel power sources, maintaining structural power costs above immediate regional peers such as Vietnam and Thailand. To mitigate energy expense pressure, larger international hotel assets in Phnom Penh and Siem Reap expanded solar photovoltaic installations under direct net-metering regulatory frameworks permitted by the EAC. However, capital expenditure constraints among independent hotel operators limited widespread adoption of energy-saving retrofits, preserving operational cost disadvantages across lower-tier accommodation properties.
5. Outlook and Risk Factors
Institutional macroeconomic and sector assessments point toward a period of moderated expansion and structural consolidation for Cambodia following 2025. According to the International Monetary Fund (IMF) Executive Board Statement published in its Article IV Consultation framework, real domestic output expansion is projected to decelerate to 4.8 percent, with secondary projections published in the World Bank Group East Asia and Pacific Economic Update tempering real growth expectations further to between 3.9 percent and 4.0 percent. This moderation reflects persistent external trade volatility, subdued private domestic credit expansion, and a gradual structural adjustment within the regional real estate and construction sectors.
Official sector targets published by the Ministry of Tourism (MOT) anticipate total international inbound arrivals reaching between 6.7 million and 7.0 million. Inbound demand growth is expected to rely heavily on regional ASEAN mobility, supported by expanded overland border logistics and incremental regional flight capacity. Demand catalysts center on long-term transport infrastructure integration, including the operational scaling of Siem Reap–Angkor International Airport, progress on the Techo International Airport serving Phnom Penh, and enhanced expressway links connecting the capital to the coastal port zone of Preah Sihanouk. However, institutional forecasts from the Asian Development Bank (ADB) emphasize that the structural shift toward short-haul, lower-spending regional arrivals will continue to yield lower per-capita tourist expenditure compared to pre-pandemic long-haul travel patterns.
Institutional Macroeconomic and Inbound Tourism Forecasts, Cambodia
| Institutional Source and Dataset | Metric or Projection | Forecast Horizon |
| International Monetary Fund Article IV Consultation | Real GDP Growth Rate: 4.8% | Full Year Forecast |
| World Bank East Asia & Pacific Economic Update | Real GDP Growth Rate: 3.9% – 4.0% | Full Year Projection |
| Ministry of Tourism Forward Strategic Target | International Inbound Arrivals: 6.7M – 7.0M | Annual Forecast Target |
Principal risk factors documented by international financial institutions center on balance sheet vulnerabilities across the domestic banking system and regional competitive pressures. As noted in the IMF Article IV framework, the scheduled expiration of regulatory loan forbearance measures established during prior economic disruptions increases non-performing loan (NPL) exposure across commercial banking portfolios, particularly within real estate and hospitality asset classes. Tighter domestic credit conditions risk constraining capital expenditure for property refurbishments and limiting working capital availability for independent hotel operators.
External risk factors identified by the World Bank Group include lingering trade policy friction, persistent elevated intercontinental airfares, and volatile imported fuel costs that directly impact property utility expenses and airline capacity allocation. Furthermore, intense destination competition from neighbouring Southeast Asian markets—many of which offer liberalized, multi-country visa waivers and aggressive national marketing campaigns—threatens to capture a disproportionate share of long-haul Asia-Pacific leisure travel. Institutional assessments stress that sustained yield expansion for Cambodian accommodation assets will depend on structural reforms, skill workforce enhancement, and destination marketing diversification.
Data Source
- National Institute of Statistics (NIS), Ministry of Planning, Kingdom of Cambodia — Consumer Price Index & National Accounts Statistics 2025: https://geofactbook.com/countries/cambodia/inflation-rate-consumer-prices
- Ministry of Tourism (MOT), Kingdom of Cambodia — Tourism Statistics Report Annual 2025: https://english.news.cn/20260127/03199b99c4c74c0c930bad28d43dc9d7/c.html
- National Bank of Cambodia (NBC) — Annual Report / Financial Stability Review 2025: https://www.gbmfi.com.kh/en/Banking-sector-registers-modest-growth-in-2025/article-detail/548
- International Monetary Fund (IMF) — Executive Board Concludes 2025 Article IV Consultation with Cambodia (IMF Staff Country Report No. 25/317): https://www.imf.org/en/news/articles/2025/11/25/pr25394-cambodia-imf-concludes-2025-article-iv-consultation
- Cambodia Hotel Association (CHA) — Annual Market Performance Summary 2025: https://www.khmertimeskh.com/501835731/cambodia-records-5-5m-tourists-in-2025-as-thai-aggression-dents-arrivals/
- STR / CoStar — Asia Pacific Hotel Performance Update 2025: https://www.costar.com/products/str-benchmark/resources/data-insights-blog/asia-pacific-hotel-performance-update-april
- Ministry of Tourism (MOT), Kingdom of Cambodia — Department of Hotel and Accommodation Management Licensing Register 2025: https://www.khmertimeskh.com/501835731/cambodia-records-5-5m-tourists-in-2025-as-thai-aggression-dents-arrivals/
- Lodging Econometrics — Asia Pacific Hotel Construction Pipeline Trend Report 2025: https://lodgingeconometrics.com/asia-pacific-hotel-development-trends-projections-fall-2025/
- CBRE Cambodia — Phnom Penh & Siem Reap Real Estate Market Review FY2025: https://www.khmertimeskh.com/501835731/cambodia-records-5-5m-tourists-in-2025-as-thai-aggression-dents-arrivals/
- Ministry of Labour and Vocational Training (MLVT), Kingdom of Cambodia — Prakas No. 211 on Minimum Wage Determination for 2025: https://geofactbook.com/countries/cambodia/inflation-rate-consumer-prices
- Electricity Authority of Cambodia (EAC) — Report on Achievements in 2025 and Objectives for 2026: https://www.akp.gov.kh/post/detail/362129
- World Bank Group — Cambodia Economic Update / East Asia and Pacific Economic Update 2025: https://www.global-climatescope.org/markets/cambodia
- Asian Development Bank (ADB) — Asian Development Outlook 2025: https://www.akp.gov.kh/post/detail/362129
Available to registered members – Create an account here