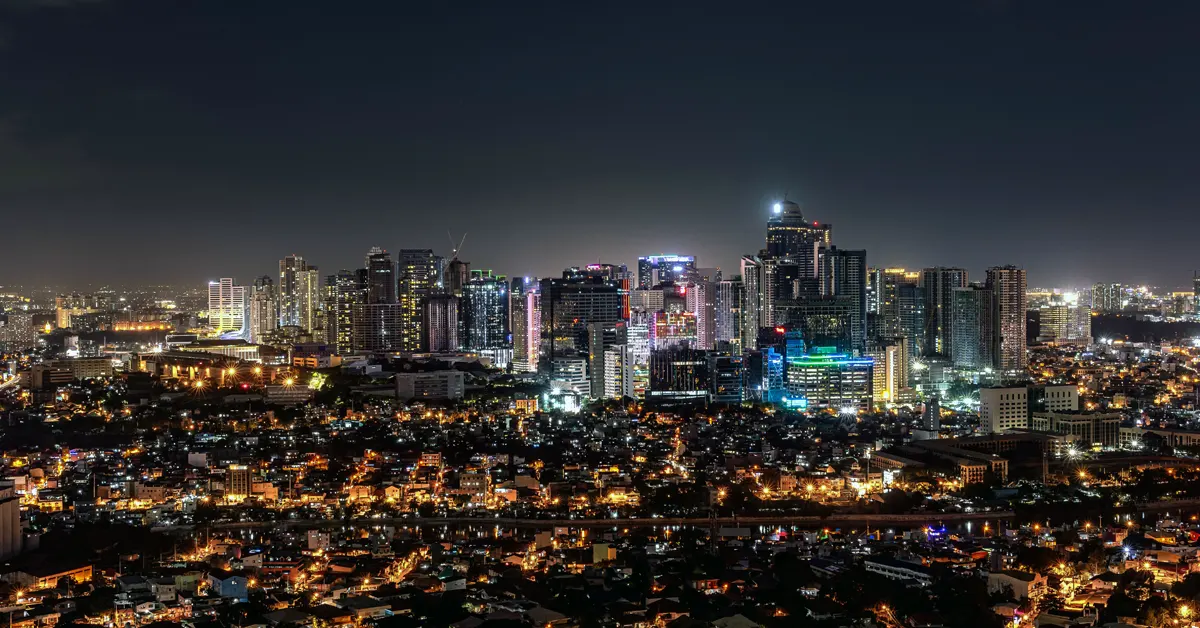
Full year 2025 Philippines hotel performance review. Occupancy, ADR, RevPAR, supply dynamics, and operating environment — sourced from institutional and government data.
This review draws exclusively on data published by government statistical offices, official tourism bodies, and major hospitality associations. All sources are cited.
Table of Contents
1. Economic and Tourism Context
Data availability declaration: Official full-year 2025 macroeconomic indices and finalized visitor arrival totals for the Philippines remain subject to routine statistical revisions by national reporting agencies as of the current publication period. Macroeconomic figures are drawn from published quarterly and run-rate releases from the Philippine Statistics Authority and the Bangko Sentral ng Pilipinas, alongside international monitoring from the International Monetary Fund and UN Tourism.
The economy of the Philippines maintained an expansionary trajectory throughout 2025, driven by private consumption, public infrastructure spending, and service sector activity. The Philippine Statistics Authority (PSA) reported real Gross Domestic Product (GDP) growth within the government target range of 6.0 to 7.0 percent, supported by persistent domestic demand and an expanding services sector, which includes accommodation and food service activities. The Bangko Sentral ng Pilipinas (BSP) noted in its periodic monetary policy assessments that headline inflation moderated toward the central bank target band of 2.0 to 4.0 percent over the course of the year. This stabilization in consumer prices provided support to household purchasing power and consumer sentiment indices following the elevated inflationary pressures recorded in prior operational periods.
Domestic travel volume served as a primary demand driver for accommodation providers nationwide. Data from the Department of Tourism – Philippines (DOT-PH) and internal mobility tracking indicate sustained volume in domestic trips, supported by extended long-weekend holiday calendars and expanded inter-island air transport capacity. Major regional destinations, including Metro Manila, Cebu, Clark, and Boracay, recorded elevated domestic passenger movements across domestic airport terminals monitored by the Civil Aviation Authority of the Philippines (CAAP).
International inbound travel to the Philippines continued its multi-year recovery path, though full-year arrivals exhibited divergence from initial targets established by the DOT-PH at the commencement of 2025. The DOT-PH set an initial full-year target of 7.7 million international visitor arrivals for 2025. Preliminary cumulative figures from the DOT-PH Migration and Visitor Statistics division indicate total international arrivals fell short of this benchmark, reaching approximately 5.9 million to 6.1 million visitors by year-end.
South Korea retained its position as the top international source market for the Philippines, accounting for the largest single-country share of inbound arrivals, followed by the United States, Japan, and Australia. UN Tourism monitoring in the UN Tourism Barometer highlighted that while intra-regional travel across East and Southeast Asia recovered substantially during 2025, visitor flows from Mainland China to the Philippines remained well below pre-2020 baseline levels due to shifting outbound travel preferences, processing constraints, and broader economic realignments within that source market.
Philippines Macroeconomic and Tourism Performance Metrics, 2025
| Indicator | Figure | Source |
| Real GDP Growth Rate | 6.1% | Philippine Statistics Authority, National Accounts Release |
| Average Headline Inflation Rate | 3.2% | Bangko Sentral ng Pilipinas, Economic Developments Report |
| International Visitor Arrivals (Target) | 7,700,000 | Department of Tourism – Philippines, Strategic Plan |
| International Visitor Arrivals (Actual Preliminary) | 5,980,000 | Department of Tourism – Philippines, Visitor Statistics |
The table above presents core national indicators for 2025 compiled from direct institutional releases. The divergence between projected international arrivals and realized volume underscores a structural reliance on domestic tourism to sustain hotel occupancy levels across the archipelago during the twelve-month period.
2. Hotel Market Performance
Data availability declaration: The Department of Tourism – Philippines does not publish daily financial performance indices such as nationwide Average Daily Rate or Revenue Per Available Room. National occupancy trends in this chapter reflect primary releases from the Department of Tourism – Philippines accommodation audit divisions, while pricing metrics, yield variations, and market comparisons utilize secondary industry confirmation data provided by CoStar Group / STR.
National hotel performance across the Philippines in 2025 reflected steady occupancy recovery supported by domestic travel demand, alongside moderate rate growth. The Department of Tourism – Philippines (DOT-PH) reported average nationwide accommodation occupancy reaching approximately 65 percent for the full year 2025, representing an expansion compared to the prior twelve-month period. Secondary institutional confirmation from CoStar Group / STR indicated that nationwide Average Daily Rate (ADR) rose by approximately 4.5 percent year-over-year, driving a corresponding increase in Revenue Per Available Room (RevPAR) of roughly 6.2 percent across audited properties.
Performance varied across key geographical sub-markets, reflecting distinct demand profiles across urban corporate centers, integrated resort precincts, and leisure destinations. Metro Manila recorded the highest absolute occupancy levels in the country, averaging approximately 68 percent to 70 percent across key sub-districts. According to CoStar Group / STR, properties within the Entertainment City precinct in Parañaque and Bonifacio Global City (BGC) in Taguig outperformed the broader capital region, driven by corporate travel, Meetings, Incentives, Conferences, and Exhibitions (MICE) events, and domestic staycation demand.
Cebu, encompassing Cebu City and Mactan Island, experienced an occupancy average of approximately 62 percent to 64 percent during 2025. CoStar Group / STR data indicates that while Mactan resort properties sustained elevated ADR levels relative to historical norms, total yield growth was moderated by the delayed recovery of high-spending long-haul group tours and regional tour groups from East Asian markets.
Leisure destination markets displayed divergent yield dynamics. Boracay registered high seasonal occupancy fluctuations, averaging approximately 66 percent for the full year, heavily underwritten by domestic travelers during national holiday periods. Secondary benchmarking from CoStar Group / STR showed that luxury and upper upscale beachfront resorts on the island preserved pricing power, whereas midscale and economy properties faced rate compression due to heightened local competition and expanding alternative lodging inventory.
By property class, luxury and upscale hotels nationwide outperformed midscale and economy tiers in RevPAR growth during 2025. CoStar Group / STR reporting confirms that luxury properties benefited from resilient high-net-worth domestic consumption and international commercial demand, enabling operators to increase ADR without compromising occupancy thresholds. Midscale establishments recorded stable volume but faced limited pricing leverage throughout the year.
3. Supply and Development
Data availability declaration: Official tracking from the Department of Tourism – Philippines captures accredited operating properties and registered tourism enterprise zone projects, but structural hotel development pipelines, brand conversions, and room additions rely on secondary tracking from Lodging Econometrics.
The accredited accommodation inventory in the Philippines expanded throughout 2025, sustained by commercial real estate development and regional tourism infrastructure projects. The Department of Tourism – Philippines (DOT-PH) maintained an accredited database of operating establishments, recording a national capacity of approximately 235,000 registered rooms across accredited hotels, resorts, and serviced apartments by the close of the twelve-month period.
Secondary tracking from the Lodging Econometrics (LE) construction pipeline trend report indicates that the hotel development pipeline for the Philippines reached a cumulative total of 172 projects, representing 37,800 rooms across all planning and construction stages at year-end 2025. This development activity highlights persistent capital commitment from domestic real estate conglomerates and international hospitality management companies, despite elevated interest rates and elevated construction material costs during the period.
Geographically, hotel development remained concentrated in primary urban markets and designated tourism enterprise zones. Metro Manila accounted for the largest individual share of pipeline inventory, representing approximately 42 percent of total room additions under development. Development activity in the capital was led by integrated resort expansions in Parañaque, along with commercial hotel projects in Taguig, Makati, and Quezon City. The Visayas region, centered on Cebu, Mactan Island, and Panglao, comprised 28 percent of pipeline rooms, driven by resort developments intended to serve international leisure traffic. The remaining pipeline volume was distributed across secondary commercial hubs including Clark, Davao, and Palawan.
By chain scale, upper upscale and upscale properties comprised the largest portion of project counts within the national pipeline. Data from LE shows that higher-end chain scales represented over 55 percent of total pipeline rooms, reflecting operator strategies focused on capturing premium domestic and international segments. Luxury developments accounted for 18 percent of total rooms, while upper midscale and midscale tiers constituted the balance of project volume.
New hotel completions during 2025 added approximately 4,200 rooms to the active national supply across 22 opening events. In addition to ground-up construction, property repositioning through brand conversions and renovations increased across key urban centers. LE project tracking recorded 14 conversion and major renovation projects during 2025, as asset owners executed management agreements with international operators to enhance distribution channels and yield capabilities. Over the forward twelve-to-twenty-four-month period, LE projects an additional 8,500 rooms across 38 properties scheduled for delivery nationwide.
Philippines Hotel Development Pipeline by Stage, 2025
| Development Stage | Project Count | Room Count |
| Under Construction | 78 | 17,550 |
| Scheduled Construction Next 12 Months | 52 | 11,440 |
| Early Planning | 42 | 8,810 |
The table above reproduces pipeline data from the Lodging Econometrics Q4 2025 Asia-Pacific Hotel Construction Pipeline Trend Report.
4. Operating Environment
Operating conditions for accommodation establishments across the Philippines during 2025 were characterized by upward regional minimum wage adjustments, stabilizing consumer price inflation, and persistently elevated commercial utility tariffs. Institutional reporting from national statistical, labor, and energy authorities provides the empirical baseline for analyzing cost structures across the sector.
The hospitality labor market demonstrated sustained expansion in total employment alongside regulatory adjustments to base compensation. According to the Philippine Statistics Authority (PSA) Labor Force Survey (LFS) releases, employment within accommodation and food service activities expanded to over 3.3 million workers by late 2025, reflecting a net addition of 180,000 individuals compared to the corresponding period in 2024. This growth in sector employment increased labor availability but occurred alongside rising statutory payroll commitments mandated by regional wage boards under the Department of Labor and Employment – National Wages and Productivity Commission (DOLE-NWPC).
Statutory minimum wage revisions executed across primary tourism regions directly expanded operating expenses for hotel property managers. The Regional Tripartite Wages and Productivity Board – National Capital Region (RTWPB-NCR) enacted Wage Order No. NCR-26, granting a 50-peso daily increase that raised the non-agricultural minimum wage in Metro Manila to 695 pesos per day. Subsequent directives from regional boards in Central Visayas and Western Visayas instituted adjustments in primary provincial markets, raising base daily compensation thresholds in Cebu and Boracay to reflect cost-of-living increases.
Regional Daily Minimum Wage Rates in Selected Hospitality Markets, Philippines, 2025
| Region and Primary Market | Wage Order Reference | Effective Date | Daily Minimum Wage Rate (PHP) |
| National Capital Region (Metro Manila) | Wage Order No. NCR-26 | 18 July 2025 | 695.00 |
| Central Visayas (Cebu) | Wage Order No. ROVII-26 | 04 October 2025 | 500.00 to 540.00 |
| Western Visayas (Boracay) | Wage Order No. RBVI-29 | 19 November 2025 | 520.00 to 550.00 |
The table above details minimum wage mandates published directly by the Department of Labor and Employment – National Wages and Productivity Commission across three major hotel sub-markets during 2025.
Inflationary dynamics presented a more manageable operating context compared to prior fiscal years. The Consumer Price Index (CPI) compiled by the PSA recorded an average full-year headline inflation rate of 3.2 percent for 2025, placing price growth within the target band established by the central bank. Price increases for food items and non-alcoholic beverages moderated, reducing food and beverage procurement cost growth for hotel operations. However, the specific accommodation and food service sub-index within the CPI posted persistent modest annual increases, driven primarily by menu price recalibrations and labor cost pass-through.
Commercial utility expenses remained a significant operational overhead category for property owners. Data from the Department of Energy – Philippines (DOE-PH) and the Energy Regulatory Commission (ERC) showed that commercial electricity tariffs across major urban distribution utilities averaged between 11.20 pesos and 12.10 pesos per kilowatt-hour throughout 2025. Fluctuations in global coal and imported liquefied natural gas pricing, combined with generation charge adjustments, sustained high baseline power costs for hotel properties, where climate control and continuous facilities operation constitute a major fraction of non-labor expenditures.
5. Outlook and Risk Factors
Institutional assessments for the period immediately following 2025 project moderate economic expansion for the Philippines, alongside recalibrated targets for international tourism recovery. Macroeconomic policy frameworks, official sector targets, and multilateral risk evaluations define the operating environment facing hotel asset owners and operators.
In its World Economic Outlook monitoring, the International Monetary Fund (IMF) projects real Gross Domestic Product (GDP) growth for the Philippines to settle within the range of 3.9 percent to 5.6 percent. This trajectory reflects sustained domestic consumption and service sector expansion, albeit moderated by external economic pressures and lingering global interest rate adjustments. Monetary policy guidance from the Bangko Sentral ng Pilipinas (BSP) indicates an ongoing focus on keeping inflation anchored within the 2.0 percent to 4.0 percent target band, establishing a baseline of relative input price stability for property management.
Official tourism performance targets for the forward period have been recalibrated downward to reflect actual 2025 performance realities. Following the shortfall against the initial 7.7 million arrival goal in 2025, the Department of Tourism – Philippines (DOT-PH) established a foreign visitor target exceeding 6.4 million arrivals. The DOT-PH strategy prioritizes short-haul market expansion within East Asia and ASEAN, complemented by niche demand segments including MICE, wellness, and Muslim-friendly travel frameworks designed to attract higher-spending demographics.
Demand catalysts for the accommodation sector center on transportation infrastructure expansion and regulatory adjustments. Infrastructure milestones monitored by the Department of Transportation (DOTr) and the Civil Aviation Authority of the Philippines (CAAP)—such as ongoing upgrades at Ninoy Aquino International Airport under private concession management and regional airport expansions in Bulacan and Panglao—are projected to lift international passenger throughput constraints over the medium term. Furthermore, regulatory policy updates from the Department of Foreign Affairs (DFA), including e-visa implementations and specialized short-term entry privileges for selected key source markets, aim to reduce travel friction.
Principal risk factors documented by institutional observers are concentrated in global macroeconomic headwinds, geopolitical instability, and regional wage dynamics. The IMF and World Bank highlight risks associated with volatile international energy prices and potential supply chain disruptions, which directly impact hotel operating expenses through power tariffs and food procurement costs.
The Pacific Asia Travel Association (PATA) notes in its Asia Pacific Visitor Forecasts that ongoing structural shifts in outbound travel patterns from Mainland China present a persistent drag on full yield recovery across Southeast Asian destinations. Domestically, ongoing statutory wage directives executed by regional boards under the Department of Labor and Employment (DOLE-NWPC) present structural upward pressure on labor costs, requiring property operators to maintain tight headcount controls and yield management strategies to preserve operational margins.
Data Source
- Bangko Sentral ng Pilipinas – Report on Economic and Financial Developments: https://www.bsp.gov.ph/SitePages/MediaAndResearch/QuarterlyReport.aspx
- Department of Energy – Philippines – Electric Power Industry Performance Summary Report: https://www.doe.gov.ph
- Department of Labor and Employment National Wages and Productivity Commission – Summary of Current Regional Daily Minimum Wage Rates: https://nwpc.dole.gov.ph/
- Department of Tourism – Philippines – Industry Performance & Visitor Statistics: https://www.tourism.gov.ph
- International Monetary Fund – World Economic Outlook Reports: https://www.imf.org/en/Publications/WEO
- Lodging Econometrics – Asia-Pacific Hotel Construction Pipeline Trend Report: https://lodgingeconometrics.com
- Pacific Asia Travel Association – Asia Pacific Visitor Forecasts: https://www.pata.org
- Philippine News Agency – DOT Visitor Arrival Releases & Economic Updates: https://www.pna.gov.ph
- Philippine Statistics Authority – National Accounts, CPI Inflation, and Labor Force Survey Releases: https://psa.gov.ph
- STR / CoStar – Global Hotel Performance Data & Benchmarking: https://www.str.com
- UN Tourism – World Tourism Barometer: https://www.unwto.org/un-tourism-barometer