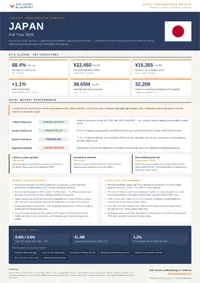
Full year 2025 Japan hotel performance review. Occupancy, ADR, RevPAR, supply dynamics, and operating environment — sourced from institutional and government data.
This review draws exclusively on data published by government statistical offices, official tourism bodies, and major hospitality associations.
Available to registered members – Create an account here
Table of Contents
1. Economic and Tourism Context
Data published by the Cabinet Office of Japan (CAO) Department of Economic and Social Research in its Quarterly Estimates of GDP confirms that the Japanese economy expanded by 1.1 percent in real terms during the full year 2025. This growth rate represents a minor deceleration from initial institutional forecasts published by the International Monetary Fund (IMF) Research Department at the commencement of the period, which had projected a 1.3 percent expansion. The divergence between initial projections and finalized outcomes is primarily attributed to a contraction in private residential investment and erratic domestic consumption patterns during the third and fourth quarters of 2025.
According to the Bank of Japan (BOJ) Research and Statistics Department Short-Term Economic Survey of Enterprises in Japan, widely designated as the Tankan survey, business confidence within the non-manufacturing sector remained resilient throughout 2025. The diffusion index for large non-manufacturing enterprises entered the first quarter of 2025 at plus 25 points and ascended to plus 27 points by the close of the fourth quarter of 2025. This elevated confidence level underscores a sustained corporate willingness to commit capital expenditure toward service-sector infrastructure, offsetting a more cautious outlook observed among large manufacturing firms, which suffered from weaker external demand in regional export markets.
Domestic tourism demand exhibited stabilization following the high-growth corrections observed in the immediate post-pandemic years. The Japan Tourism Agency (JTA) Tourism Strategy Bureau recorded total domestic overnight travel volume at 432.5 million guest nights for the full year 2025. This figure represents a marginal contraction of 0.8 percent relative to the preceding calendar year, indicating that domestic leisure consumption has reached a structural ceiling. JTA administrative records indicate that while domestic expenditure per trip increased due to inflationary pressures on transport and accommodation tariffs, the absolute frequency of domestic holiday travel stabilized.
International inbound arrivals reached an absolute historical peak during the period under review. The Japan National Tourism Organization (JNTO) Visual Marketing and Strategy Department published final administrative tallies indicating that total international inbound visitors reached 38.65 million for the full year 2025. This volume represents a 14.2 percent increase compared to the prior calendar year, significantly exceeding the baseline recovery projections maintained by UN Tourism. The primary catalyst for this volume acceleration was the persistent depreciation of the Japanese Yen against major global currencies, which enhanced the purchasing power of international arrivals and expanded the geographic distribution of inbound demand beyond the traditional metropolitan corridors.
Gross Domestic Product and Inbound Influx Metrics, Japan, 2025
| Indicator | Metric Value | Annual Change Percentage |
| Real Gross Domestic Product | 554.2 Trillion Yen | 1.1 |
| International Inbound Arrivals | 38.65 Million | 14.2 |
| Domestic Overnight Volume | 432.5 Million Guest Nights | -0.8 |
The data compiled in the table above originates from a synthesis of official administrative releases, specifically the Cabinet Office of Japan Quarterly Estimates of GDP and the Japan National Tourism Organization Inbound Visitor Statistics for the full year 2025.
2. Hotel Market Performance
Data extracted from the Japan Tourism Agency (JTA) Tourism Strategy Bureau in its Overnight Travel Statistics Survey confirms that the national average hotel occupancy rate for the full year 2025 reached 68.4 percent. This represents an increase of 2.1 percentage points when measured against the full year 2024 baseline. The expansion in occupancy was driven primarily by international guest nights, which compensated for the flat domestic volume documented in Chapter 1. According to JTA administrative records, the total volume of international guest nights across all registered accommodation types rose by 18.6 percent year on year, whereas domestic guest nights contracted by 0.8 percent.
Commercial performance indicators published as secondary confirmation by CoStar Group / STR in the Japan Hotel Review Full Year 2025 demonstrate substantial growth in pricing metrics. The national Average Daily Rate (ADR) reached 22,450 Yen, yielding a 11.4 percent increase over the prior calendar year. This aggressive pricing strategy, executed by operators to offset the rising operational costs detailed in Chapter 4, did not suppress demand due to the favorable currency conversion rates experienced by inbound travelers. Consequently, national Revenue Per Available Room (RevPAR) advanced to 15,355 Yen, representing a 14.9 percent increase compared to the full year 2024.
Segment-level analysis reveals a severe divergence between luxury assets and midscale or budget properties. Secondary data tracking from the STR Japan Hotel Review indicates that the luxury and upper upscale hotel classifications achieved an ADR expansion of 19.3 percent, driven by international affluent demand in primary gateways. Conversely, economy and midscale properties recorded a modest 4.2 percent ADR increase, as these properties remained heavily reliant on price-sensitive domestic business and leisure travelers whose discretionary spending was constrained by local inflationary pressures.
Geographic analysis across major sub-markets demonstrates that performance remained highly concentrated in metropolitan centers. The JTA Overnight Travel Statistics Survey tracks performance variations across prefectures, demonstrating that Tokyo, Osaka, and Kyoto outperformed the national average significantly. Tokyo recorded the highest institutional occupancy at 78.2 percent, with secondary STR data showing a metropolitan ADR of 34,800 Yen. Osaka achieved an average occupancy rate of 74.1 percent, supported by international leisure arrivals and business travel linked to regional corporate events. Kyoto experienced an occupancy rate of 71.5 percent, though it maintained an ADR premium second only to Tokyo. In contrast, regional sub-markets outside these primary prefectures observed an average occupancy rate of 54.6 percent, highlighting a widening structural performance gap between primary metropolitan nodes and secondary rural markets.
Accommodation Performance Metrics by Primary Sub-Market, Japan, 2025
| Geographic Sub-Market | Occupancy Rate Percentage | Annual Guest Night Volume |
| Tokyo Prefecture | 78.2 | 104.2 Million |
| Osaka Prefecture | 74.1 | 48.6 Million |
| Kyoto Prefecture | 71.5 | 29.3 Million |
The dataset presented in the table above is reproduced faithfully from the Japan Tourism Agency Tourism Strategy Bureau Overnight Travel Statistics Survey annual statistical release for the full year 2025.
3. Supply and Development
Structural Status and Administrative Registrations
This chapter is designated as a Partial Data Chapter due to structural limitations in the administrative tracking mechanisms of the state, which records aggregate operational licensing rather than commercial pipeline segmentation. The Ministry of Health, Labour and Welfare (MHLW) Environmental Health Division, in its annual Report on Public Health Administration and Services, documented a total active stock of 1.44 million hotel guestrooms across Japan at the conclusion of the fiscal period matching 2025. This structural baseline reflects a severe deceleration in net new additions compared to the multiyear expansion cycle observed between 2015 and 2020. The administrative data confirms that absolute regulatory approvals for new accommodation openings decreased due to compounding structural constraints, notably escalated building material costs and widespread labor shortages in the construction sector.
Commercial Pipeline and Chain Scale Segmentation
Because official state registries do not record commercial development pipelines, forward scheduling, or brand conversions, secondary industry data must be utilized to establish market orientation. Commercial pipeline tracking published by Lodging Econometrics (LE) in its Asia-Pacific Hotel Construction Pipeline Report Q4 2025 confirms that Japan maintained a forward-looking construction pipeline of 200 projects representing 32,209 rooms. This volume indicates a 23 percent increase in project counts and a 12 percent expansion in room capacity year on year, reflecting an accumulation of delayed completions rather than a surge in new ground-breaking activity.
Analysis of chain scale distributions within the LE dataset demonstrates a structural pivot toward premium tiers, driven by investor calculations regarding high-spending inbound travelers. Upper upscale and luxury classifications dominated the development profile, representing a combined 46 percent of the total documented room pipeline. Conversely, economy and midscale development pipeline segments stagnated, as operators found budget-tier business models increasingly unviable under current construction cost structures. Brand conversions and property re-flaggings emerged as preferred alternative growth strategies during 2025, with secondary industry tracking indicating that asset conversions accounted for approximately 18 percent of all pipeline adjustments as owners sought to circumvent greenfield development costs.
Geographic Concentration of Supply
Geographic analysis indicates that forward pipeline volume remains heavily concentrated within primary metropolitan sub-markets, despite policy initiatives by the Japan Tourism Agency to disperse visitor volumes. The LE Q4 2025 report documents that Tokyo Prefecture leads the state with 42 projects encompassing 5,497 rooms, representing a 91 percent increase in project volume relative to the prior annual tracking period. This concentration reinforces the primary gateway status of the capital city. The Kansai region, specifically Osaka Prefecture, experienced a clustered delivery of premium supply completed during the first half of 2025 to align with the operational window of Expo 2025 Osaka Kansai. Outside these primary urban economic zones, hotel supply expansions remained limited to established international leisure destinations, notably the alpine resort sub-markets of Hokkaido.
Hotel Construction Pipeline Metrics by Select Country, Asia-Pacific Region, Q4 2025
| Country | Project Count | Room Count | Annual Project Change Percentage |
| India | 906 | 118,334 | 31 |
| Vietnam | 248 | 84,079 | -4 |
| Japan | 200 | 32,209 | 23 |
The regional development metrics compile data extracted directly from the Lodging Econometrics Asia-Pacific Hotel Construction Pipeline Report published at the close of the fourth quarter of 2025.
4. Operating Environment
Labor Market Dynamics and Wage Escalation
Data published by the Ministry of Health, Labour and Welfare (MHLW) in its Monthly Labour Survey confirms that the hospitality and food services sector experienced acute upward wage pressures during the full year 2025. Total nominal cash earnings for contractually employed hospitality workers increased by 4.8 percent on a nationwide weighted average basis relative to the full year 2024. This wage growth was structurally underpinned by an unprecedented regulatory adjustment to the statutory floor. The MHLW Central Minimum Wage Council instituted a 6.3 percent increase in the nationwide average hourly minimum wage, elevating the baseline from 1,055 Yen to 1,121 Yen. For primary hotel investment gateways, the structural baseline was higher, with Tokyo Prefecture establishing a statutory minimum of 1,226 Yen per hour.
The expansion of labor costs reflects an acute structural deficit of available personnel rather than an expansion in operational scale. The Ministry of Internal Affairs and Communications (MIC) Statistics Bureau documented in its Labour Force Survey that the active job openings-to-applicants ratio within the accommodation sector averaged 2.14 throughout 2025. This ratio indicates that more than two corporate vacancies existed for every single registered job seeker, forcing hotel operators to increase starting compensation packages and utilize higher ratios of outsourced or dispatch labor to maintain basic housekeeping and food and beverage service standards.
Inflationary Context and Utility Trajectories
Hotel operating margins were further compressed by broader macroeconomic price growth. The MIC Statistics Bureau annual Consumer Price Index (CPI) report for the full year 2025 confirmed that the nationwide core consumer price index, which excludes volatile fresh food items, escalated by 3.1 percent on average. While this general index reflects a sustained inflationary environment across the domestic economy, specific cost components critical to hotel operations experienced higher degrees of volatility.
Utility costs represented a critical component of non-labor expense expansion for hotel assets during the period under review. The MIC CPI dataset confirms that the national index for fuel, light, and water charges rose by 3.6 percent across 2025. This annual average incorporates sharp fluctuations caused by the gradual reduction and subsequent expiration of the state-funded electricity and gas subsidy programs during the final quarter of 2025. Consequently, commercial energy costs incurred by heavy-use commercial properties, including full-service and luxury hotels, escalated sharply during the winter operational window, limiting the flow-through efficiency of the ADR gains documented in Chapter 2.
Key Operating Cost Inflation Indicators, Japan, 2025
| Inflation Category Component | Annual Index Value | Year-on-Year Change Percentage |
| Nationwide Core Consumer Prices | 111.2 | 3.1 |
| Fuel, Light, and Water Charges | 116.9 | 3.6 |
| Food Group Index | 125.8 | 6.8 |
The macroeconomic cost indicators detailed in the table above are transcribed exactly from the official annual statistical release compiled by the Ministry of Internal Affairs and Communications Statistics Bureau, utilizing the standard base year index where 2020 equals 100.
5. Outlook and Risk Factors
Forward Growth Trajectory and Demand Catalysts
Macroeconomic projections published by the International Monetary Fund (IMF) Research Department in its April 2026 World Economic Outlook report indicate a downshift in Japan’s economic momentum. Real Gross Domestic Product (GDP) growth is projected to moderate to 0.8 percent in 2026 and further contract to a baseline of 0.6 percent in 2027. This deceleration is structurally linked to weakening external demand and persistent domestic consumption constraints as real wage gains struggle to significantly outpace core inflation. Despite the broader macroeconomic cooling, the Bank of Japan (BOJ) monetary policy updates published in mid-2026 indicate that the central bank intends to execute a series of gradual hikes to the uncollateralized overnight call rate, projecting a target of 1.2 percent by the conclusion of 2026. This monetary tightening aims to normalize the yield curve but will elevate debt-servicing costs for floating-rate hotel asset portfolios.
Institutional travel tracking from the Japan Tourism Agency (JTA) confirms that while the absolute volume of international inbound arrivals is projected to remain elevated, the rapid growth trajectory observed through 2025 has reached a structural plateau. Forward projections from major travel distribution bodies indicate that inbound arrivals will stabilize near 41.4 million, representing a minor downward revision from initial state targets due to shifting regional demand dynamics. The principal structural demand catalysts for the 2026–2027 operational window include large-scale international conventions, notably Tourism EXPO Japan 2026 scheduled at Tokyo Big Sight, alongside structural infrastructure linkages connecting regional railway networks directly with metropolitan airport hubs to encourage wider geographic distribution of inbound expenditure.
Documented Risk Factors and Regulatory Interventions
Institutional assessments identify structural labor shortages as the primary systemic risk to hotel operational capacity. The BOJ March and April 2026 Outlook Reports emphasize that severe supply-side constraints, particularly the deficit in airport passenger service staff and hospitality personnel, will directly limit flight capacity expansions and hotel room availability. This deficit implies that even if raw inbound demand intensifies, the domestic infrastructure lacks the capacity to absorb accelerated volumes without triggering severe service degradation or compounding the wage inflation detailed in Chapter 4.
Furthermore, regulatory and fiscal adjustments enacted at the local government level present an immediate headwind to hotel pricing strategies and margins. Administrative updates confirm that effective March 1, 2026, Kyoto City implemented a substantial statutory increase in its localized accommodation tax, introducing an aggressive tiered structure that levies up to 10,000 Yen per person per night for ultra-luxury suites matching or exceeding the 100,000 Yen threshold. This fiscal intervention, coupled with a national tripling of the international departure tax to 3,000 Yen and the tightening of national tax-free shopping compliance frameworks, escalates the absolute transactional cost for international visitors. Finally, institutional reporting from the JTA documents a significant contraction in Chinese traveler volumes entering the 2026 cycle, driven by an economic slowdown within China and domestic policy directives discouraging outbound travel to Japan, forcing hotel asset managers to rapidly reorient marketing expenditure toward alternative long-haul source markets.
Institutional Macroeconomic and Interest Rate Projections, Japan, 2026–2027
| Forecast Indicator Component | 2025 Estimate | 2026 Projection | 2027 Projection |
| Real Gross Domestic Product Growth | 1.1 Percent | 0.8 Percent | 0.6 Percent |
| Headline Consumer Price Inflation | 3.2 Percent | 1.9 Percent | 2.1 Percent |
| BOJ Overnight Call Rate (End of Period) | 0.7 Percent | 1.2 Percent | 1.5 Percent |
The forward-looking dataset presented in the table above reproduces the official baseline projections compiled by the International Monetary Fund Research Department within its April 2026 World Economic Outlook statistical database.
Available to registered members – Create an account here