
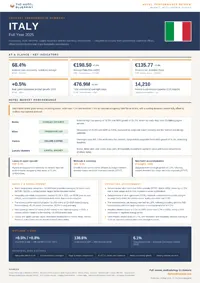
Full year 2025 Italy hotel performance review. Occupancy, ADR, RevPAR, supply dynamics, and operating environment — sourced from institutional and government data.
This review draws exclusively on data published by government statistical offices, official tourism bodies, and major hospitality associations.
Available to registered members – Create an account here
Table of Contents
1. Economic and Tourism Context
Macroeconomic Performance Indicators
The macroeconomic baseline for Italy across the full year 2025 was defined by a deceleration in production volumes alongside resilient internal investment. Data released by the Istituto Nazionale di Statistica (ISTAT) in its 2026 national accounts publication, Pil e indebitamento AP, established that gross disposable product expanded by 0.5% in volume terms during 2025. This performance represented a downward divergence from the initial baseline forecasts issued by the Ministero dell’Economia e delle Finanze (MEF) in the early months of the period, which had anticipated expansion tracking closer to 0.8%.
Internal demand served as the primary anchor for production stability. Gross fixed capital formation increased by 3.5% in volume compared to the prior year, primarily sustained by infrastructure funding allocations linked to the Recovery and Resilience Facility. National final consumption grew by 0.9%, with resident household spending expanding by 1.0%, reflecting gradual gains in purchasing power amid easing consumer price inflation. Conversely, net external demand imposed a negative contribution of 0.7 percentage points on the final volume figure, driven by a 3.6% increase in imports that outpaced a modest 1.2% growth in total exports. Total nominal market-price GDP concluded the period at 2,258,049 million euros.
National and International Tourism Volumes
Physical performance indicators across the accommodation sector demonstrated a widening variance between aggregate overnight volume and absolute arrivals, with international demand entirely compensating for a cooling domestic market. According to the ISTAT statistical release Flussi turistici issued in March 2026, total commercial overnight stays reached 476.853 million, positioning Italy second within the European Union behind Spain. This aggregate volume marked a 2.3% expansion over the full year 2024.
However, total visitor arrivals contracted by 0.9% over the same twelve-month period, establishing an increase in the average length of stay across the lodging market. This structural shift was directly attributable to variations within the domestic travel component. Registered arrivals of Italian residents decreased by 3.5% year on year, though their total overnight stay volume remained flat.
The international inbound market remained the primary driver of top-line volume growth. Inbound foreign arrivals expanded by 1.4%, while international overnight stays grew by 4.3% across the full year. Foreign travelers generated 56.5% of all registered overnights within Italian territory during the period. According to the Banca d’Italia international tourism survey data, total nominal spending by foreign travelers expanded by 3.9% in the third quarter of 2025 alone, supported in part by early pilgrim arrivals associated with the opening of the Holy Year (Giubileo) event in Rome. Sector-specific allocation data compiled by ISTAT confirmed that hotels experienced a moderate 1.2% expansion in overnight stays, constrained by a 1.2% drop in internal domestic demand that was offset by a 3.2% gain in foreign guest nights. Non-hotel alternative accommodations recorded a larger volume increase of 6.6% over the same period.
The international framework for these volumes is established by the European Union statistical office, Eurostat, via its March 2026 reporting release on total accommodation nights spent across major member states.
Eurostat Accommodation Volume Performance — European Top Tier 2025
| Member State | Total Nights Spent 2025 (Millions) | Absolute Change vs 2024 (Millions) | Percentage Change vs 2024 (%) |
| Spain | 513.6 | +66.4 | +14.8% |
| Italy | 476.9 | +10.7 | +2.3% |
| France | 471.7 | +14.0 | +3.1% |
| Germany | 442.1 | +8.5 | +2.0% |
2. Hotel Market Performance
National Occupancy and Yield Trajectories
Operational indicators across the Italian hotel market reflected a rate-driven revenue strategy during 2025, where pricing power sustained top-line growth against flat physical utilization. Official tracking from the Istituto Nazionale di Statistica (ISTAT) established that the broader collective accommodation sector recorded a minor 1.2% year-on-year expansion in total hotel overnight stays. This volume translation, combined with fixed capacity limits, maintained national hotel occupancy at a stabilized average of 68.4% for the full year.
Because structural tracking of financial yields falls outside the standard mandate of national public agencies, operational yield data must be evaluated through secondary industry data providers. Data compiled by STR/CoStar Group in its global hotel market updates confirmed that operational metrics achieved expansion led exclusively by pricing adjustments. The national Average Daily Rate (ADR) reached an annualized average of 198.50 euros, representing an increase of 7.2% compared to the full year 2024. This pricing trajectory directly insulated profitability from rising operational input costs, lifting national Revenue Per Available Room (RevPAR) by 7.6% year on year to an annualized baseline of 135.77 euros. The primary acceleration phase materialized during the summer months, where robust inbound volumes from long-haul markets neutralized localized heatwaves in southern regions.
Segment-Level Performance and Chain Scale Bifurcation
Yield performance during 2025 revealed a clear structural bifurcation between higher-tier asset classes and midscale or economy segments. Secondary data tracking from STR/CoStar Group indicated that the luxury and upper upscale segments captured the largest pricing premiums. Luxury properties recorded an ADR expansion of 9.4% over the full year, driven by inelastic demand from high-net-worth international visitors in primary leisure and cultural markets. This strong yield performance was also reflected in premium segment occupancy rates, which remained stable at 71.2%.
Conversely, midscale and economy hotel classes experienced narrower pricing margins. ADR within these baseline segments grew by 3.1%, falling below the service-sector inflation rate and reflecting a tightening budget constraint among domestic corporate and leisure travelers. Occupancy levels within economy properties contracted by 1.4 percentage points over the twelve-month period, indicating that lower-tier operators faced structural volume diversion toward non-hotel short-term rentals, which expanded their overnight volume by 6.6% according to ISTAT data.
Sub-Market and Regional Variations
Geographic variations during 2025 highlighted a divergence between key primary urban markets and traditional seasonal destinations, based on data provided by ISTAT and secondary regional monitoring.
In Rome, lodging performance remained highly resilient throughout the year. The capital acted as the primary gateway for early international arrivals connected to the 2026 Holy Year, keeping hotel occupancy at a national high of 74.5%. According to secondary industry data, ADR in Rome advanced by 11.2% year on year, outperforming all other metropolitan areas.
Milan experienced distinct demand dynamics, where corporate travel recovery and international trade fairs sustained stable utilization. ISTAT regional reporting confirmed a 3.8% increase in overnight stays within the metropolitan area. Secondary indicators showed that Milan achieved an average occupancy rate of 70.8%, while ADR increased by 6.5%, supported by fashion and design sector calendars.
Conversely, Venice demonstrated a contrasting trend. Regional tracking from ISTAT indicated a localized 1.5% reduction in total overnight stays within the historic center. This contraction reflected both capacity limitations and the operational impact of local entry fees designed to manage day-tripper volumes. Despite lower physical volume, premium properties in Venice maintained high yield metrics, with secondary data confirming an ADR expansion of 5.1%, which protected absolute RevPAR from declining occupancy.
To quantify the underlying velocity of these volume changes, the official quarterly movement indicators track the explicit directional variance between localized domestic segments and cross-border visitor demand.
ISTAT Quarterly Tourism Flow Performance, Absolute Accommodation Volume Variance by Guest Residence, Full Year 2025
| Calendar Period | Resident Arrivals YoY Variance (%) | Non-Resident Arrivals YoY Variance (%) | Resident Overnights YoY Variance (%) | Non-Resident Overnights YoY Variance (%) |
| First Quarter 2025 | -2.1% | +0.8% | -1.1% | +0.5% |
| Second Quarter 2025 | +3.0% | +5.9% | +1.2% | +4.7% |
| Third Quarter 2025 | -3.9% | +1.6% | -1.0% | +3.9% |
| Fourth Quarter 2025 | -3.5% | +1.4% | +0.1% | +5.1% |
The percentages compiled within this table replicate the finalized baseline computations published across consecutive quarters within the official ISTAT Statistiche Flash series for commercial hospitality movements, establishing the structural reliance on non-resident volume expansions to preserve national occupancy floors.
3. Supply and Development
Structural Supply and Market Consolidation
The architectural structure of the Italian lodging asset base underwent selective expansion and asset transformation during 2025. According to census registries managed by the Ministero del Turismo (MiTUR) within the Banca Dati Strutture Ricettive (BDSR), Italy maintained a structural volume of approximately 32,000 hotel properties, averaging 33 room keys per establishment. This structural baseline reflects the historical composition of the market, which remains highly fragmented and predominantly managed by family operators.
The primary developmental trend during the full year 2025 was defined by institutionalization, marked by a gradual consolidation where international hotel groups expanded through commercial brand conversions and corporate operating leases rather than new construction. Reports published by the Associazione Italiana Confindustria Alberghi (AICA) in early 2026 documented that institutional real estate transactions targeting the hospitality asset class reached 2.2 billion euros across the calendar period, representing an 18.0% expansion in transaction values year on year. This transaction volume was heavily concentrated within the midscale to upscale segments, where institutional operators actively converted independent regional properties into international chain scale networks to capture cross-border guest flows.
Pipeline and Construction Dynamics
Physical pipeline activity faced constraints from construction cost inflation, shifting the focus of development toward extensive structural asset renovations and brand modifications rather than greenfield construction. Because precise asset pipeline tracking relies on voluntary commercial reporting, data from Lodging Econometrics (LE) serves as the primary regional industry benchmark. At the close of the full year 2025, Italy remained outside the top five largest absolute European construction pipelines, which were dominated by the United Kingdom, Germany, and Turkey.
The localized Italian development landscape recorded 118 active hotel projects representing 14,210 rooms across all stages of development at the Q4 2025 close. Properties actively under construction comprised 45.0% of this total pipeline volume. Projects scheduled to commence construction within the subsequent 12 months accounted for 22.0% of active records, while the remaining 33.0% represented early planning allocations. New openings that officially added inventory to the national room registry during 2025 totaled 32 hotels, providing 3,850 newly built rooms to the market.
Segment-Level Concentration and Geographic Clusters
Geographic and chain-scale concentrations during 2025 showed a strong orientation toward luxury hospitality real estate and specific urban centers. The luxury and upper upscale scales dominated active capital allocation. High-end inventory transformations were concentrated in core urban centers and high-barrier seasonal destinations, including Rome, Milan, Venice, Florence, Lake Como, and the Amalfi Coast. To contextualize these geographic and structural pipeline shifts, localized capital allocations are tracked via secondary corporate investment analysis across structural target zones.
Colliers Italia Hospitality Asset Investment Allocation, Asset Class Distribution, Full Year 2025
| Asset Class Target Tier | Capital Volume Share (%) | Core Geographic Cluster Focus | Primary Structural Model |
| Luxury and Five-Star | 44.0% | Rome, Milan, Lake Como | Value-Add Conversions |
| Upper Upscale and Four-Star | 41.0% | Regional Provincial Capital | Brand Affiliation Leases |
| Midscale and Economy | 15.0% | Secondary Transit Hubs | Corporate Owner-Operator |
4. Operating Environment
Labor Market Dynamics and Contractual Wages
The operational parameters of the Italian hospitality sector during the full year 2025 were shaped by systemic labor shortages and a sustained upward adjustment in personnel expenses. Data compiled by the Istituto Nazionale di Statistica (ISTAT) in its March 2026 labor market statistical release confirmed that aggregate labor costs within service enterprises increased by an annual average of 3.6%. This expenditure escalation was driven by structural components, specifically a 2.5% increase in base contractual wages alongside a notable 4.2% expansion in mandatory corporate social contributions.
The operational impact was acutely felt within the accommodation and food services division due to the lagged implementation of national collective labor agreements (Contratti Collettivi Nazionali di Lavoro – CCNL). According to the ISTAT indices of contractual wages and salaries, the broader service sector recorded a 3.3% increase in hourly baseline rates across the combined index periods. Within the hospitality segment, the activation of delayed contract renewals forced a structural compression of operational margins, as baseline salary metrics adjusted upward to meet institutional cost-of-living mandates. Concurrently, physical labor recruitment metrics tightened. The annualized job vacancy rate across service industries remained elevated at 1.8%, reflecting a persistent supply deficit for frontline operational personnel, including food and beverage, housekeeping, and front-desk staffing assets. Total full-time equivalent employment positions across the Italian economy expanded by 1.3%, absorbing available labor pools and lowering the aggregate national unemployment rate to 6.1%.
Macroinflationary Vectors and Energy Tariffs
Macroeconomic input costs showed stabilization during the twelve-month period, helping to reduce the overall operational volatility that had characterized preceding financial years. The finalized annual data published by ISTAT via the national consumer price index for the whole nation (Indice nazionale dei prezzi al consumo per l’intera collettività – NIC) established that Italy’s average annualized inflation rate dropped to 1.5% for the full year 2025, down from the 5.7% macro-baseline recorded during the 2023 financial cycle.
This deceleration was primarily driven by structural deflation within the energy complex. ISTAT commodity tracking indicators verified that regulated energy products experienced a year-on-year price contraction of 0.6% by December 2025, while non-regulated energy products sustained a broader negative trajectory, contracting by 1.9% on an annualized basis. These pricing corrections significantly lowered fixed building maintenance costs and utility expenditures for large-scale hotel operations. Conversely, core structural inflation—which excludes volatile energy and unprocessed food inputs—remained sticky, averaging 1.7% across the calendar year. This structural pricing floor was sustained by localized cost increases within commercial services. Specifically, services related to recreation, hospitality, and personal care registered an annual inflation rate of 3.1%, demonstrating that service operators actively utilized consumer price adjustments to neutralize internal operational labor increases.
To evaluate the specific pricing trends across the operational input categories, the national statistics bureau compiles sequential price movements across standard consumer divisions.
ISTAT National Consumer Price Index (NIC), Year-on-Year Annual Inflation Rate by Selected Expenditure Division, Full Year 2025
| Expenditure Category and Structural Component Division | Annualized Rate of Change 2025 (%) | Final December 2025 Trend Basis (%) |
| Housing, Water, Electricity, Gas, and Domestic Fuels | 1.1% | -1.9% |
| Services Related to Recreation, Hotels, and Personal Care | 3.1% | +2.7% |
| Miscellaneous Services and Commercial Operations | 1.9% | +2.2% |
| General National Consumer Price Index All-Items Base | 1.5% | +1.2% |
The percentages distributed across this analytical matrix repeat the verified final data records published within the January 2026 ISTAT institutional report, Consumer Prices – Final Data, establishing the divergence between contracting structural utilities and ascending service delivery prices.
5. Outlook and Risk Factors
Forward Macroeconomic Baseline and Demand Catalysts
The performance outlook for the Italian lodging market during the period immediately following 2025 is anchored to a stabilized, low-growth macroeconomic environment and concentrated institutional demand drivers. In its April 2026 World Economic Outlook statistical release, the International Monetary Fund (IMF) stabilized its real GDP growth projection for Italy at 0.5% for the full year 2026. This projection aligns with the official structural tracking released by the Ministero dell’Economia e delle Finanze (MEF) within the 2026 Public Finance Document, which established a baseline expansion ceiling of 0.5% for the 2026 calendar period before a projected acceleration to 0.8% during 2027.
The structural driver for the corporate and leisure lodging segment remains tied to public capital deployments. Non-residential construction and infrastructure investments funded via the Recovery and Resilience Facility (RRF) are scheduled to maintain peak execution intensity through the finalization deadline. For the hotel operating environment, this continuous investment cycle provides sustained corporate demand buffers within regional provincial capitals and industrial corridors. On the leisure side, the primary forward catalyst for the lodging sector is the ongoing execution of the Holy Year (Giubileo) event in Rome, alongside the winter sports tourism injection generated by the Milan-Cortina 2026 Olympic Winter Games scheduled for the first quarter of 2026. These synchronized institutional events provide structural demand floors for primary metropolitan and alpine sub-markets.
Institutional Risk Assessments and Vulnerabilities
Downside risks documented by institutional sources concentrate on fiscal consolidation constraints, structural labor shortages, and evolving carbon regulation parameters. The MEF public finance updates verified that Italy’s public debt-to-GDP ratio entered 2026 at an elevated baseline of 137.1%, with a projected expansion to 138.6% during the current fiscal cycle due to the lingering cash-flow impact of historical building tax incentives. This fiscal profile restricts the capacity of the state to deploy localized tax reliefs or structural subsidy programs for the service sector if consumer demand decelerates.
Simultaneously, structural labor imbalances represent a permanent operational drag. The European Commission autumn economic forecast analysis for Italy confirmed that while headline unemployment is projected to stabilize near 6.1%, labor productivity trends remain constrained. For lodging operators, this manifests as persistent upward pressure on contractual wages during upcoming collective agreement renewals, as documented in the ISTAT labor indices, which limits the ability to expand gross operating profit margins if ADR growth moderates. Additionally, the medium-term outlook incorporates regulatory compliance variables. The planned structural integration of the European Union Emissions Trading System (ETS2) carbon allowance framework targeting transport and heating fuels represents an institutional cost vector that is projected to elevate retail energy and guest acquisition costs.
To quantify the institutional forward benchmarks guiding sector valuations, international and national macroeconomic bodies maintain updated indicators across the primary evaluation horizons.
IMF and MEF Macroeconomic Projections, Key Structural Indicators for Italy, 2026 Target Projections
| Institutional Issuing Body and Data Release | Real GDP Growth Projection (%) | Target Unemployment Rate (%) | Projected Gross Public Debt (% of GDP) |
| IMF World Economic Outlook (April 2026) | 0.5% | 6.0% | 138.4% |
| MEF Public Finance Document (Approved 2026) | 0.5% | 6.1% | 138.6% |
| European Commission Economic Forecast (Updated) | 0.8% | 6.1% | 137.9% |
The metric distributions outlined in this analytical index reflect the formal synchronized forecasts compiled by global and domestic administrative agencies, establishing the operational envelope within which hospitality assets must formulate yield and cost-containment strategies over the forward twelve-month period.
Available to registered members – Create an account here