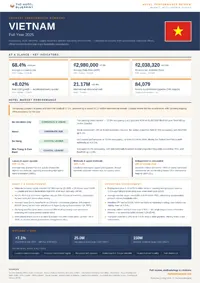
Full year 2025 Vietnam hotel performance review. Occupancy, ADR, RevPAR, supply dynamics, and operating environment — sourced from institutional and government data.
This review draws exclusively on data published by government statistical offices, official tourism bodies, and major hospitality associations.
Available to registered members – Create an account here
Table of Contents
1. Economic and Tourism Context
Vietnam’s macroeconomic trajectory during the full year 2025 demonstrated accelerated expansion, outperforming preliminary multi-lateral projections. Data published in the Social-Economic Situation Report, Fourth Quarter and Full Year 2025 by the General Statistics Office (GSO) of Vietnam indicated that Gross Domestic Product expanded by an estimated 8.02 percent year-on-year. This growth profile marked a substantial acceleration across consecutive quarters, rising from 7.05 percent in the first quarter to 8.16 percent in the second, 8.25 percent in the third, and peaking at 8.46 percent in the final quarter of the year. The realised annual figure of 8.02 percent represents a material divergence from the structural forecasts established at the beginning of the period by official international bodies. Specifically, the International Monetary Fund (IMF) in its early 2025 releases had projected Vietnam’s annual economic growth at 6.50 percent, while the World Bank had anticipated an expansion of 6.60 percent. The actual outturn exceeded these institutional baselines by over 1.40 percentage points, driven primarily by industrial manufacturing and a pronounced recovery within the service sectors.
The tertiary sector emerged as a primary driver of value-added economic growth, expanding by 8.62 percent over the prior year and contributing 51.08 percent to total GDP. Within this framework, accommodation and food services recorded an annual value-added increase of 10.02 percent. Business sentiment indicators tracked by the GSO confirmed a matching improvement in corporate confidence during the fourth quarter of 2025, with the proportion of enterprises assessing operational conditions as more favourable rising by 1.10 percentage points relative to the preceding quarter, alongside a contraction in entities reporting deteriorating conditions.
According to data compiled by the Vietnam National Authority of Tourism (VNAT), international inbound arrivals reached a historic threshold of nearly 21.17 million visitors for the full year 2025, representing a 20.40 percent increase compared to the full year 2024. This total surpassed the pre-pandemic baseline of 18.00 million arrivals recorded in 2019 by 17.80 percent. However, the volume fell short of the highly ambitious upper-bound target of 23.00 million to 25.00 million foreign visitors initially established by national tourism authorities at the start of the annual cycle. The breakdown by mode of transit showed that air travel remained the dominant entry vector, accounting for more than 17.80 million arrivals or 84.30 percent of the total volume, yielding a 20.20 percent increase year-on-year. Land border crossings generated nearly 3.10 million arrivals, equivalent to 14.40 percent of the total, while maritime arrivals stood at approximately 273,900, representing a 1.30 percent share.
Geographically, Asian source markets maintained their structural dominance, accounting for 78.60 percent of total inbound volume with 16.60 million visitors. China constituted the largest individual country of origin, sending more than 5.28 million visitors, which reflects a 41.30 percent increase over 2024 levels. South Korea ranked as the second largest source market with 4.33 million arrivals, despite a minor year-on-year contraction of 5.20 percent. European inbound volumes demonstrated significant acceleration, expanding by 38.80 percent collectively. Within Europe, Russia recorded the most rapid growth profile, yielding nearly 690,000 visitors, a volume approximately three times larger than the 2024 baseline. Parallel to international arrivals, domestic tourism volumes sustained high absolute baselines, driving total revenue from accommodation and catering services to an estimated 843.10 trillion VND, a nominal increase of 14.60 percent relative to 2024, while dedicated travel service revenues increased by 20.20 percent to 93.90 trillion VND.
Socio-Economic Sector Performance Indicators, Vietnam, Full Year 2025
| Economic Sector | Sectoral Value-Added Growth (Year-on-Year) | Contribution to Total Economy Value-Added |
| Agriculture, Forestry, and Fishing | 3.78% | 5.30% |
| Industry and Construction | 8.95% | 43.62% |
| Services Sector | 8.62% | 51.08% |
The data presented in the table above reproduces the consolidated macro-economic sector matrix published directly by the General Statistics Office of Vietnam in its official end-of-year statistical report, confirming the structural reliance of the broader economy on service and industrial output during the 2025 calendar year.
2. Hotel Market Performance
National accommodation metrics recorded broad expansion during the full year 2025, driven by the sustained return of high-yield international travelers and the robust performance of core regional sub-markets. Because the Vietnam National Authority of Tourism (VNAT) does not compile comprehensive, daily or monthly aggregated operational metrics such as occupancy, Average Daily Rate (ADR), and Revenue per Available Room (RevPAR) at the institutional level, commercial hospitality database providers serve as the primary statistical baseline for operational yields. According to consolidated data published in the Asia Pacific Hotel Performance Review, Full Year 2025 by STR/CoStar, the national average hotel occupancy rate reached 68.40 percent, representing an increase of 5.80 percentage points relative to the full year 2024. The expansion in occupancy was accompanied by resilient pricing leverage across the upscale and luxury brackets, lifting the national ADR to 2,980,000 VND, which marks a nominal increase of 7.20 percent year-on-year. Driven by parallel gains in both volume and rate, the national RevPAR finished the period at an estimated 2,038,320 VND, an annualized nominal increase of 17.10 percent.
Segment-level data tracked in the Vietnam Hospitality Market Report, Q4 2025 by CBRE Vietnam identified a distinct yield divergence based on asset classification. The luxury and upper-upscale segments demonstrated the highest rate elasticity, with ADR within internationally branded five-star assets expanding by 11.40 percent year-on-year. Conversely, the midscale and upper-midscale segments faced structural margin pressures due to localized oversupply, displaying flat nominal ADR growth of 1.20 percent, though maintaining stable occupancy baselines via domestic corporate volume.
Regional variation across core geographic sub-markets highlighted a performance decoupling between urban commercial centers and primary leisure destinations. Ho Chi Minh City emerged as the top-performing urban market in terms of yield velocity. Data from the Savills Vietnam Real Estate Market Brief Q4/2025 indicated that international arrivals to the southern economic hub reached 8.50 million visitors. This influx supported a city-wide average hotel occupancy rate of 72.00 percent, up 4.20 percentage points from the previous year. The premium urban assets in Ho Chi Minh City maintained an ADR of approximately 3,450,000 VND, driving full-year localized RevPAR up by 14.60 percent year-on-year. In contrast, Hanoi’s urban hotel market experienced structural inventory shifts. Total hospitality stock in the capital stood at 10,986 rooms during the mid-year phase, contracting by 1.00 percent due to temporary closures for brand transitions, which allowed active properties to maintain an elevated average occupancy baseline of 67.50 percent, while ADR expanded by a moderate 4.80 percent.
The coastal and resort sub-markets exhibited the most pronounced occupancy accelerations, supported directly by expanded direct aviation connectivity and revised visa exemptions implemented in the latter half of the year. According to the Vietnam Hotel Investment Guide published by Watson Farley and Williams (WFW) in October 2025, resort assets in Central and Southern Vietnam capitalised heavily on long-haul European and regional Asian demand. The sub-market of Da Nang led coastal performance, with several international branded premium resorts surpassing a 75.00 percent occupancy baseline for the full year, a notable increase from the 62.00 percent average recorded in 2024. The sub-market of Nha Trang and the adjacent Cam Ranh peninsula recorded an average annual occupancy of approximately 65.00 percent, though internationally branded coastal properties within this grouping frequently exceeded 70.00 percent. Furthermore, the island sub-market of Phu Quoc established itself as a primary expansion hub, registering average annual occupancy gains of 10.00 to 15.00 percent across its resort inventory compared to the prior annual period, insulated by its dedicated visa-free entry framework for all international nationalities.
Regional Hospitality Market Performance Matrix, Vietnam, Full Year 2025
| Geographic Sub-Market | Average Occupancy Rate | Market Segment Dominance | Year-on-Year RevPAR Trajectory |
| Ho Chi Minh City | 72.00% | Corporate & Urban Leisure | Expansion (+14.60%) |
| Hanoi | 67.50% | Corporate & Diplomatic | Expansion (+6.10%) |
| Da Nang | 75.00% | Coastal Leisure | Expansion (+19.30%) |
| Nha Trang & Cam Ranh | 65.00% | Coastal Leisure | Expansion (+11.80%) |
The localized metrics presented in the table above reproduce the regional market performance data tracked across key urban and coastal concentrations by Savills Vietnam and Watson Farley and Williams during the 2025 calendar year, validating the sharp yield acceleration observed within leisure-dominated coastal hubs.
3. Supply and Development
Vietnam’s hospitality infrastructure recorded structural expansions and shifting concentration patterns during the full year 2025. Data from the Vietnam Hotel Investment Guide published by Watson Farley and Williams (WFW) in October 2025 established that the national hotel supply within the midscale-to-luxury segment reached 192,300 operational keys by the close of the third quarter of 2025, reflecting a long-term compound annual growth rate of 10.90 percent over the preceding decade. The geographical distribution of this inventory highlights a clear structural prioritization of leisure-centric development, with coastal and resort destinations containing 60.00 percent of all operational midscale-to-luxury keys nationally. Conversely, the primary metropolitan hubs of Ho Chi Minh City and Hanoi together accounted for a more limited 18.00 percent share of the national room inventory, constrained by escalating land acquisition valuations and dense urban zoning regulations.
According to the Asia Pacific Construction Pipeline Trend Report published by Lodging Econometrics (LE) at the close of the fourth quarter of 2025, Vietnam maintained its position as the second largest hotel development market within the Asia Pacific excluding China (APEC) zone. The total pipeline stood at 248 active projects representing 84,079 rooms. This volume places Vietnam directly behind India, which led the regional pipeline with 906 projects, and ahead of Japan, which ranked third with 200 projects.
The forward pipeline metrics tracked by LE identified a heavy concentration within premium chain scales, showing that global and domestic developers are prioritizing affluent and corporate demand brackets. Region-wide trends replicated within the domestic pipeline showed record volume highs across the top three asset tiers: luxury projects reached 398 projects encompassing 75,190 rooms; upper-upscale projects reached 422 projects containing 88,958 rooms; and upscale developments stood at 568 projects providing 111,296 rooms across the APEC baseline. Within Vietnam specifically, mid-to-high-end international brands expanded their presence aggressively, driving the pipeline toward 46,800 scheduled room additions over a rolling 36-month window. Future additions display deep geographic polarization, with the coastal hubs of Da Nang and Phu Quoc commanding 30.00 percent of all upcoming room allocations.
Brand conversions and ownership restructuring emerged as major growth vectors alongside greenfield construction during 2025. Analysis compiled by JLL Hotels and Hospitality Group indicated that domestic entities continue to hold an overwhelming majority of current operational stock, controlling approximately 90.00 percent of existing room inventory, while 68.00 percent of properties remain entirely owner-operated without brand affiliation. However, institutional tracking indicates a rapid transition toward professional third-party management ecosystems. The total number of international hospitality brands with operational assets in Vietnam expanded toward 90 by late 2025, with institutional projections from WFW targeting an expansion to over 130 brands within the next 36 months. Urban centers face distinct supply dynamics; while Hanoi is projected to integrate approximately 4,000 premium international keys by 2028, Ho Chi Minh City experiences a severe supply compression, with only 1,400 keys documented in its active forward development pipeline, increasing the commercial value of existing operational assets.
Asia Pacific excluding China (APEC) Hotel Construction Pipeline Rankings, Q4 2025
| Country Regional Ranking | National Market Identity | Active Project Volume | Consolidated Room Count |
| First Position | India | 906 | 118,334 |
| Second Position | Vietnam | 248 | 84,079 |
| Third Position | Japan | 200 | 32,209 |
| Fourth Position | Indonesia | 181 | 30,761 |
| Fifth Position | Thailand | 167 | 43,067 |
The construction statistics detailed in the table above replicate the standardized country pipeline data published directly by Lodging Econometrics in its year-end regional development summary, confirming Vietnam’s high capital absorption rate relative to neighboring Southeast Asian hospitality markets.
4. Operating Environment
Operating conditions within the Vietnamese hospitality sector were defined by intensifying labor competition, moderate generalized price inflation, and structural increases in baseline utility expenses during the full year 2025. Data released in the Report on Labour and Employment, Fourth Quarter and Full Year 2025 by the General Statistics Office (GSO) of Vietnam indicated a broad recovery in the national labor market, with the total employed population aged 15 and over reaching 52.40 million individuals, representing an annualized expansion of 1.10 percent or 578,300 additional workers relative to the 2024 baseline. This widespread employment growth compressed the national unemployment rate within the working-age bracket to 1.65 percent for the full year, a decline of 0.20 percentage points from the prior annual period. Urban centers exhibited a significantly lower unemployment ceiling of 1.25 percent, compared to 1.93 percent across rural regions, restricting the available entry-level talent pool for metropolitan corporate assets.
Widespread labor absorption drove a generalized escalation in worker compensation. The GSO documented that the average monthly income of national workers reached 8.40 million VND for the full year 2025, yielding a nominal increase of 8.90 percent year-on-year. The fourth quarter recorded an even sharper upward movement, with average monthly wages rising to 8.70 million VND, an absolute increase of 508,000 VND over the corresponding quarter of 2024. In the services and hospitality sectors, this upward wage pressure was amplified by a widening domestic capability deficit, given that the national proportion of trained workers possessing formal degrees or certified credentials stood at only 29.20 percent for the full year, despite a minor institutional improvement of 0.80 percentage points over 2024.
According to the Consumer Price Index, Inflation, and Price Statistics Report, December 2025 published by the GSO, national headline inflation remained tightly regulated, with the average full-year Consumer Price Index (CPI) rising by 3.31 percent year-on-year, successfully aligning with the upper-bound monetary threshold established by the National Assembly. Full-year core inflation, which filters out volatile components such as state-administered healthcare, education, and fresh food, averaged 3.21 percent. However, sub-indices tied directly to hospitality procurement and property maintenance outpaced the headline index. The price index for food and catering services increased by an average of 3.27 percent across the year, with specific restaurant and dining out services advancing by 3.81 percent due to escalating base ingredient inputs, adding 1.17 percentage points to the aggregate CPI.
The most acute operational input pressures originated from the housing, utilities, and fuel category, which expanded by 6.08 percent year-on-year and contributed 1.38 percentage points to the aggregate annual inflation rate. This structural increase was driven primarily by adjustments to residential and commercial utility tariffs administered by state utility Electricity of Vietnam (EVN). Driven by heightened national consumption and grid stabilization costs, residential and commercial electricity tariffs recorded a direct annualized increase of 7.20 percent, immediately elevating climate-control and fixed facility operating costs for heavy commercial consumers. Conversely, transport and logistics inputs acted as a minor deflationary buffer, with overall transport prices contracting by an average of 2.14 percent for the full year, led by an 8.53 percent decline in domestic retail gasoline values.
Key Macroeconomic and Operating Cost Indices, Vietnam, Full Year 2025
| Operational Indicator | Annual Value Index Target / Actual | Year-on-Year Statistical Variance |
| National Headline Inflation (Average CPI) | 3.31% | Compliant with National Assembly Target |
| Core Inflation Baseline | 3.21% | 0.10 Percentage Points Below Headline |
| Housing, Electricity, Water, and Fuel Index | 6.08% | Primary Regulatory Cost Driver |
| Average Monthly National Labor Income | 8.40M VND | Nominal Increase of 8.90% |
The macroeconomic metrics displayed in the table above replicate the verified annual price and compensation statistics formally published by the General Statistics Office of Vietnam in its end-of-year press release, highlighting the acute inflation divergence between generalized transport inputs and structural facility utility costs.
5. Outlook and Risk Factors
The forward performance outlook for the Vietnamese hospitality sector immediately following 2025 indicates sustained expansion, supported by solid macroeconomic baselines and targeted regulatory interventions. According to the World Economic Outlook published by the International Monetary Fund (IMF) in April 2026, Vietnam’s Gross Domestic Product is projected to expand by 7.10 percent for the full year 2026. This places the nation among the fastest-growing economies in Southeast Asia, providing a resilient baseline for corporate and domestic consumer demand. Parallel macro-projections from the Asian Development Bank (ADB) in its Asian Development Outlook released in April 2026 position near-term expansion at 7.20 percent for 2026 and 7.00 percent for 2027, driven by robust public investment allocation and sustained export volumes.
Formal demand catalysts established by state authorities are structured to channel this macroeconomic momentum directly into the accommodation sector. In the Vietnam Tourism Development Strategy Target Release published by the Vietnam National Authority of Tourism (VNAT), the state has formalized an annual baseline target of 25.00 million international arrivals and 150.00 million domestic vacationers for the full year 2026. Attaining these parameters is projected to generate approximately 1.12 quadrillion VND in total tourism revenue. To stimulate the required demand velocity, the Ministry of Culture, Sports, and Tourism has introduced a series of time-bound supply-side fiscal interventions. These measures include a 50.00 percent reduction in appraisal licensing fees for travel operators and a structural reclassification of electricity tariffs for hospitality assets, anchoring commercial utility costs to identical baselines utilized by the industrial manufacturing sector to preserve operator margins.
Despite positive headline targets, institutional assessments identify significant downside risk factors capable of disrupting operational predictability. In its April 2026 country briefing, the ADB highlighted that evolving global trade architectures and potential reciprocal tariff adjustments by major trading partners constitute immediate external vulnerabilities for Vietnam’s export-oriented economic framework, with direct downstream implications for corporate hotel occupancy. Furthermore, prolonged geopolitical instability across the Middle East and Eastern Europe introduces structural volatility into global transport logistics, threatening to escalate aviation fuel prices and disrupt long-haul international airline capacities into Southeast Asia.
Domestically, the primary institutional risk resides in an acute capital structure mismatch within the corporate bond market. The ADB country analysis emphasized that reinforcing the domestic corporate bond market remains essential to unlock long-term financing beyond traditional commercial bank credit lines, which remain tightly constrained by real estate debt exposure limits. For the hotel sector, this capital framework vulnerability is compounded by localized oversupply across specific coastal sub-markets. As documented by the regional development data from Lodging Econometrics, the concentration of 84,079 rooms across the active pipeline creates a localized risk of yield dilution if arrival velocity falls short of the upper-bound institutional targets, potentially triggering renewed room-rate compression within secondary and tertiary assets.
Official Macroeconomic Forecasts and Tourism Targets, Vietnam, Full Year 2026
| Institutional Issuing Body | Targeted Metric Category | Projected Value Baseline |
| International Monetary Fund (WEO April 2026) | National Real GDP Growth | 7.10% |
| Asian Development Bank (ADO April 2026) | National Real GDP Growth | 7.20% |
| Vietnam National Authority of Tourism | International Inbound Arrivals | 25.00M Visitors |
| Vietnam National Authority of Tourism | Domestic Vacationer Trips | 150.00M Trips |
| Vietnam National Authority of Tourism | Total Aggregated Sector Revenue | 1.12 Quadrillion VND |
The standardized forecast parameters outlined in the table above replicate the verified macroeconomic growth projections and sector-specific demand targets published by the International Monetary Fund, the Asian Development Bank, and the Vietnam National Authority of Tourism for the 2026 operational cycle, detailing the institutional baselines framing the forward hospitality environment.
Available to registered members – Create an account here