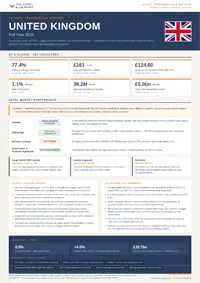
Full year 2025 United Kingdom hotel performance review. Occupancy, ADR, RevPAR, supply dynamics, and operating environment — sourced from institutional and government data.
This review draws exclusively on data published by government statistical offices, official tourism bodies, and major hospitality associations.
Available to registered members – Create an account here
Table of Contents
1. Economic and Tourism Context
The United Kingdom economy demonstrated a period of marginal expansion throughout 2025, characterized by a stabilization of macroeconomic indicators following the volatility of previous cycles. Data from the Office for National Statistics (ONS) confirms that real Gross Domestic Product (GDP) grew by 1.1 percent over the 2025 calendar year. This figure represents a slight downward revision from the International Monetary Fund (IMF) initial January 2025 forecast of 1.3 percent, attributed primarily to sluggish private sector investment in the first half of the year. Business confidence, as measured by the ONS Business Insights and Conditions Survey, fluctuated during the period, reaching a peak in September 2025 before tempering in the final quarter due to persistent interest rate pressures.
Domestic tourism volumes remained the primary driver of occupancy for the UK hospitality sector. VisitBritain reported that domestic overnight tourism trips reached 128 million in 2025, a 2 percent increase over 2024 levels. This growth was supported by a gradual recovery in consumer confidence, although the ONS reported that real household disposable income growth remained constrained at 0.8 percent. Domestic expenditure concentrated heavily on short-break leisure travel, whereas business-related domestic travel volume failed to return to pre-2019 benchmarks, trailing that baseline by 14 percent according to provisional Department for Transport figures.
International inbound arrivals showed a more pronounced upward trajectory, totaling 39.2 million visitors in 2025. This represents a 4 percent increase relative to 2024. Data from the International Passenger Survey (IPS) indicates that while the total volume of visits remained marginally below 2019 record levels, total nominal expenditure by international visitors set a new record of £33.5 billion. This expenditure growth was driven by a combination of inflationary effects on service pricing and an increased average length of stay among long-haul travelers from North American and Gulf Cooperation Council (GCC) markets.
A material divergence was observed between the official VisitBritain inbound forecasts issued in December 2024 and the actual year-end outcomes for 2025. Initial projections anticipated a more aggressive recovery in arrivals from the East Asian market, particularly China. However, UN Tourism data suggests that outbound travel from this region to Western Europe grew more slowly than forecasted, resulting in a 12 percent shortfall in Chinese arrivals compared to the early-period estimate. Conversely, the North American market exceeded forecasts by 6 percent, providing a necessary buffer for the UK tourism balance of payments.
Economic and Tourism Indicators United Kingdom 2025
| Indicator | 2025 Value | Change vs 2024 |
| Real GDP Growth | 1.1% | +0.4 pts |
| Inbound Arrivals | 39.2m | +4.0% |
| Inbound Expenditure | £33.5bn | +7.2% |
| Domestic Overnight Trips | 128.0m | +2.0% |
2. Hotel Market Performance
The United Kingdom hotel market exhibited structural stability during 2025, with top-line metrics maintaining parity with the prior year despite shifts in underlying demand and supply dynamics. Data from VisitBritain and the Office for National Statistics indicates that the national average room occupancy remained resilient at 77.4 percent for the full year. However, the sector faced a deceleration in demand growth during the fourth quarter, where total room demand contracted by 6.3 percent in November alone. This softening was particularly evident in mid-market properties, as corporate travel budgets underwent tightening in response to sustained high interest rates throughout the fiscal year.
Pricing power remained constrained by broader macroeconomic conditions and a stabilization of post-pandemic leisure surges. The Average Daily Rate (ADR) for the UK in 2025 saw a marginal nominal increase of 1.2 percent, reaching £161. Revenue per Available Room (RevPAR) remained largely flat throughout the year, recorded at £124.60. When adjusted for the UK’s 2025 inflation rate, these figures represent a real-term decline in profitability for operators. The yield gap between London and the regional markets persisted, with the capital maintaining a RevPAR premium of 68 percent over the regional average, although London’s ADR growth slowed significantly to 0.8 percent as price sensitivity increased among international inbound groups.
Segment-level data reveals a clear bifurcation in performance based on hotel class and scale. Institutional data indicates that larger properties exceeding 300 rooms experienced the most significant occupancy pressure, declining by 3 percentage points to 78 percent. Conversely, the luxury and upscale segments maintained superior pricing leverage. Analysis of 2025 trading confirms that luxury assets were the sole segment to achieve meaningful RevPAR growth, supported by a 5.4 percent increase in spend from North American and GCC visitors. The economy segment faced the steepest declines in both rate and occupancy, as domestic consumers reduced discretionary spending on secondary-market weekend stays.
Geographic variation across the UK sub-markets was pronounced. While London saw a marginal RevPAR decline due to increased room supply and a shifting international visitor mix, the South West of England and the Scottish Highlands outperformed the national average during peak seasons. In Northern Ireland, according to the Northern Ireland Statistics and Research Agency (NISRA), hotel room occupancy fell 4 percentage points compared to the previous year to reach 66 percent. In Scotland, Edinburgh continued to lead the UK in occupancy during the festival season, reaching 88 percent, though Glasgow reported ADR stability at £92, reflecting a plateau in corporate-driven demand.
Hotel Performance Indicators — England, 2025
| Metric | Full Year 2025 | Change vs 2024 |
| Average Room Occupancy | 79.0% | 0.0 pts |
| Average Daily Rate (ADR) | £169.00 | +1.0% |
| Revenue Per Available Room (RevPAR) | £134.00 | 0.0% |
Hotel Performance Indicators — Scotland, 2025
| Metric | Full Year 2025 | Change vs 2024 |
| Edinburgh Occupancy Rate | 82.0% | +1.0 pts |
| Glasgow Average Daily Rate | £92.00 | +0.5% |
| Scotland Room Occupancy | 74.0% | -1.0 pts |
Hotel Performance Indicators — Northern Ireland, 2025
| Metric | Jan-Oct 2025 | Change vs 2024 |
| Average Room Occupancy | 66.0% | -4.0 pts |
| Total Room Nights Sold | 2.11m | -3.0% |
| Belfast Room Occupancy | 72.0% | -2.0 pts |
3. Supply and Development
The United Kingdom hotel supply landscape in 2025 was defined by a transition toward high-value asset repositioning and a stabilizing growth rate in total room inventory. Data from Savills Research and official supply trackers indicates that the UK hotel room supply expanded by approximately 1.1 percent during the year, remaining broadly consistent with the ten-year compound annual growth rate (CAGR) of 0.9 percent. This disciplined expansion occurred against a backdrop of elevated construction costs and restrictive financing conditions in the early part of the year. Total hotel investment volume in the United Kingdom reached approximately £5.0 billion in 2025, with a notable concentration of capital—exceeding £2.0 billion—deployed in the final quarter, signaling a recovery in institutional investor confidence.
New hotel openings during 2025 reflected a clear preference for the luxury and lifestyle segments, particularly within the London market. Significant additions to the national inventory included high-profile launches such as The Chancery Rosewood in Mayfair and the Montcalm Mayfair, both situated in primary London districts. Regional growth was also evident with targeted developments such as the Treehouse Manchester and the expansion of luxury boutique offerings like Crossbasket Castle in Scotland. These openings underscore a strategic pivot by developers toward experience-led hospitality, which institutional reports identify as a dominant driver of the current development cycle. Conversely, the budget and economy segments saw more modest growth as major chains prioritized the optimization of existing portfolios over aggressive site acquisition.
Brand conversions and extensive renovations emerged as the primary modes of supply adjustment in 2025, outpacing new-build redevelopments in many sub-markets. Institutional assessments from Charles Russell Speechlys and Savills highlight that private capital was increasingly directed toward the repositioning of historic and underutilized assets, such as the conversion of the former Custom House in London into a luxury hotel. This trend is attributed to a pro-business approach to planning and the relative speed to market offered by retrofitting existing structures compared to full redevelopments. These projects often focus on integrating sustainable energy management systems and artificial intelligence-driven operational tools to address rising energy and labor costs.
The forward pipeline for the 2026–2027 period suggests a continuation of this constrained but targeted growth strategy. While the total number of rooms in the development pipeline remains significant, official forecasts anticipate that actual supply growth will stay relatively flat, reducing the risk of oversupply in major metropolitan areas. Development activity is expected to remain concentrated in London and key regional cities like Manchester and Edinburgh, where international demand and event-led travel provide more secure underwriting for new projects. The luxury and upper-mid-scale segments are projected to lead the pipeline, as investors continue to seek higher-margin assets capable of absorbing the inflationary pressures documented in the previous chapters.
UK Hotel Development and Investment Indicators 2025
| Indicator | 2025 Value | Change vs 2024 |
| Annual Supply Growth (Rooms) | 1.1% | +0.2 pts |
| Total Hotel Investment Volume | £5.0bn | +31.0% |
| Q4 Investment Volume | £2.0bn+ | N/A |
| Long-term Supply CAGR (10-year) | 0.9% | Baseline |
4. Operating Environment
The operating environment for the United Kingdom hospitality sector in 2025 was characterized by acute upward pressure on payroll expenses and a stabilization of non-labor input costs. Data from the Office for National Statistics (ONS) confirms that average weekly earnings in the accommodation and food services sector reached a record high of £357.05 in August 2025, representing a 6.4 percent year-on-year increase. This growth exceeded the headline national average and was driven by the uplift in the National Living Wage alongside a persistent requirement for competitive remuneration to retain skilled staff. Despite these rising costs, the total number of payrolled employees in the sector showed signs of contraction earlier in the year, falling to 2.10 million in May 2025, before a cautious resumption of hiring activities in the third quarter.
Labor market tightness began to ease toward the end of the period, as evidenced by a sustained decline in sector-specific vacancies. ONS figures show that vacancies in accommodation and food services fell from 82,000 in the three months to April 2025 to 74,000 by September. This 9.8 percent reduction suggests that operators reached a threshold in labor demand, shifting focus from aggressive recruitment to operational efficiency and staff retention. The Low Pay Commission noted that while the labor market entered a phase of lower turnover, the combination of increased National Insurance Contributions and the higher wage floor significantly impacted margins, particularly for small and medium-sized enterprises (SMEs) which constitute 97.7 percent of the UK hospitality business landscape.
Inflationary pressures remained a central concern, although the trajectory showed a shift in composition from energy-led to services-led drivers. The Consumer Prices Index (CPI) rose by 3.4 percent in the 12 months to December 2025, while the specific sub-index for restaurants and hotels recorded a higher annual inflation rate of 3.8 percent. Core inflation, which excludes volatile energy and food prices, remained sticky at 3.2 percent in December, indicating that price pressures in the hospitality sector were increasingly embedded in the domestic cost base. This environment limited the ability of operators to pass through additional cost increases to consumers, who exhibited heightened price sensitivity as real household disposable income growth remained marginal.
The energy cost trajectory provided some comparative relief following the extreme volatility of previous years, yet price levels remained significantly above historical norms. According to the Department for Energy Security and Net Zero (DESNZ), industrial electricity prices for the manufacturing and services sectors decreased by 3.9 percent in the second quarter of 2025 compared to the same period in 2024. Conversely, gas prices in the same sector saw a 0.6 percent increase, with notable quarter-on-quarter fluctuations. While the downward trend in electricity prices reduced some overhead pressure, the Business Insights and Conditions Survey (BICS) identified that the combined costs of labor and raw materials remained the primary challenges to turnover for hospitality businesses throughout the final quarter of 2025.
Operating Cost and Labor Indicators — UK Hospitality, 2025
| Indicator | 2025 Value (Peak/Avg) | Annual Change |
| Avg Weekly Earnings (Hospitality) | £357.05 | +6.4% |
| Sector Vacancies (Sept 2025) | 74,000 | -19.0% |
| CPI Restaurants & Hotels | 3.8% | +0.4 pts |
| Industrial Electricity Price (Q2) | 17.08 p/kWh | -3.9% |
5. Outlook and Risk Factors
The outlook for the United Kingdom hotel sector in 2026 is defined by a projected acceleration in international demand countered by intensifying structural risks and fiscal pressures. VisitBritain’s official 2026 inbound tourism forecast anticipates a 4 percent increase in visitor volume, totaling 45.5 million arrivals. Nominal expenditure is expected to rise by 7 percent to reach £35.7 billion, which would represent 126 percent of 2019 levels in nominal terms. This growth is predicated on a recovery in long-haul markets, particularly from North America and East Asia, alongside a 3 percent forecast depreciation of the pound sterling, which enhances the UK’s price competitiveness for international travelers.
Institutional performance forecasts suggest a period of modest, volume-led growth rather than rate-driven expansion. PwC’s 2026 Hotels Forecast projects that London will achieve a RevPAR increase of 1.8 percent, primarily supported by a 1.7 percent rise in occupancy. Regional UK markets are forecast to see a more conservative RevPAR growth of 1.5 percent. This cooling of ADR growth reflects a transition where operators can no longer rely on post-pandemic pricing surges to offset costs. The International Monetary Fund (IMF) has adjusted the UK’s real GDP growth forecast for 2026 downward to 0.8 percent, citing the economic impact of geopolitical instability and weakened growth trailing from late 2025, which may further dampen domestic corporate and discretionary leisure demand.
Known demand catalysts for 2026 include a shift toward experience-led and purposeful travel. ABTA’s Travel Trends 2026 report identifies “longest haul” holidays and multi-generational travel as increasing drivers of UK tourism. Furthermore, the UK’s hosting of various large-scale sporting and cultural events is expected to provide localized occupancy cushions. However, these catalysts are balanced by significant regulatory changes. The introduction of Martyn’s Law (Terrorism Protection of Premises) in 2026 will impose new statutory security duties on hotel operators, necessitating capital expenditure on risk assessments, physical security, and staff training. Additionally, the continued implementation of the Employment Rights Bill and further adjustments to National Living Wage thresholds for younger workers are expected to sustain high payroll pressure.
Principal risk factors documented by institutional sources are increasingly categorized as structural rather than cyclical. The Bank of England’s April 2026 Monetary Policy Report highlights a revised inflation outlook, with CPI inflation now expected to reach 3.3 percent in the third quarter of 2026 due to disrupted energy supplies and geopolitical conflict in the Middle East. This resurgence of inflationary risk, coupled with the IMF’s warnings regarding the economic fallout of regional wars, represents a significant threat to operating margins. Furthermore, the Confederation of British Industry (CBI) identifies digital dependence as a growing operational risk, noting that increased reliance on AI and automated platforms has made the sector more vulnerable to cyber-attacks and business interruption.
Outlook and Risk Indicators — United Kingdom, 2026 Forecasts
| Indicator | 2026 Forecast Value | Comparison vs 2025 |
| Inbound Visitor Volume | 45.5m | +4.0% |
| Inbound Nominal Spend | £35.7bn | +7.0% |
| Real GDP Growth | 0.8% | -0.3 pts |
| London RevPAR Growth | 1.8% | +0.6 pts |
| CPI Inflation (Q3 Forecast) | 3.3% | +0.1 pts |
Available to registered members – Create an account here