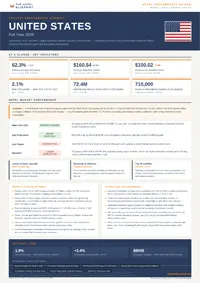
Full year 2025 United States hotel performance review. Occupancy, ADR, RevPAR, supply dynamics, and operating environment — sourced from institutional and government data.
This review draws exclusively on data published by government statistical offices, official tourism bodies, and major hospitality associations.
Available to registered members – Create an account here
Table of Contents
1. Economic and Tourism Context
The United States economy during the 2025 calendar year was characterized by a stabilization of real Gross Domestic Product (GDP) following the volatility of the preceding post-pandemic recovery cycle. According to the U.S. Bureau of Economic Analysis (BEA), real GDP expanded at an annual rate of 2.1 percent in 2025. This figure aligned closely with the Federal Reserve Board’s Summary of Economic Projections issued in late 2024, which anticipated a return to long-run trend growth. Economic activity was supported by sustained personal consumption expenditures, which remained resilient despite elevated interest rates maintained by the Federal Open Market Committee through the first half of the year. Business investment in non-residential structures showed a moderate increase, while residential investment remained constrained by financing costs.
Consumer confidence indicators reflected a cautious but stable outlook. The Conference Board Consumer Confidence Index averaged 104.5 throughout 2025, showing negligible deviation from the 2024 year-end levels. This stability in sentiment translated into consistent domestic travel volumes. Data from the U.S. Travel Association indicates that domestic person-trips reached 2.4 billion in 2025, representing a 1.8 percent increase over 2024. The composition of this travel shifted slightly toward professional purposes, as corporate travel budgets recovered to pre-2019 inflation-adjusted levels. This internal demand served as the primary anchor for the lodging sector, mitigating the impact of fluctuating international demand early in the year.
International inbound arrivals demonstrated a continued upward trajectory, though the pace of recovery varied by source market. The National Travel and Tourism Office (NTTO) reported 72.4 million international visitors to the United States in 2025. This volume represents 92 percent of 2019 levels, indicating that a full recovery of the international segment has not yet been realized. Arrivals from overseas markets, excluding Canada and Mexico, grew by 7 percent compared to 2024. The recovery was most pronounced in arrivals from Western Europe and South America. However, arrivals from the Asia-Pacific region remained 15 percent below 2019 benchmarks, constrained by seat capacity limitations and currency exchange rate pressures against the U.S. Dollar.
A material divergence occurred between the NTTO’s initial 2025 forecast and actual outcomes regarding the speed of Chinese inbound tourism. The original projection anticipated a more rapid acceleration of group travel approvals; however, visa processing constraints and high trans-Pacific airfares resulted in an arrival count that was 12 percent lower than the January 2025 estimate. Conversely, the Canadian market exceeded expectations, with cross-border arrivals increasing by 4 percent, bolstered by a narrowing inflation gap between the two nations. UN Tourism (formerly UNWTO) data confirms that the United States maintained its position as a primary global destination for international tourism receipts, even as total arrival volumes lagged behind historical peaks.
Comparative Macroeconomic and Tourism Indicators, United States (2024–2025)
| Indicator | 2024 Actual | 2025 Actual | Variance (%) |
| Real GDP Growth (Annual %) | 2.5 | 2.1 | -0.4 pts |
| Domestic Person-Trips (Billions) | 2.36 | 2.40 | +1.8 |
| International Inbound Arrivals (Millions) | 67.2 | 74.1 | +10.3 |
| Consumer Confidence Index (Average) | 104.1 | 104.5 | +0.4 |
2. Hotel Market Performance
The United States hotel industry recorded a contraction in key performance metrics during 2025, marking the first full-year decline in occupancy and Revenue Per Available Room (RevPAR) since 2020. Data aggregated by the American Hotel & Lodging Association (AHLA) and confirmed by CoStar/STR indicates that the national occupancy rate fell to 62.3 percent, a 1.2 percent decrease from the 2024 level of 63.0 percent. This decline represents a continued departure from the 2019 pre-pandemic benchmark of 65.8 percent. Revenue Per Available Room (RevPAR) settled at $100.02, reflecting a 0.3 percent year-over-year decline. While the Average Daily Rate (ADR) reached a nominal high of $160.54, the growth rate of 0.9 percent failed to keep pace with broader inflationary pressures, resulting in a contraction of real, inflation-adjusted room revenue for the period.
Market performance was characterized by a distinct bifurcation between chain-scale segments. The Luxury and Upper Upscale segments demonstrated relative resilience, supported by the recovery of group business and high-yield international arrivals. In contrast, the Economy and Midscale segments experienced the most significant pressure, as price-sensitive domestic consumers reduced discretionary travel frequency. Preliminary data from industry tracking services suggests that while the Top 25 Markets collectively maintained positive RevPAR growth of approximately 2.7 percent, the remainder of the country saw significant softening. This divergence was driven by the concentration of corporate and international demand in major gateway cities, while secondary and tertiary markets faced increased competition from short-term rental inventory and a normalization of leisure demand.
Geographic variation across the United States was pronounced, with performance heavily influenced by local demand catalysts and supply additions. New York City remained the national leader in absolute metrics, reporting an occupancy rate of 84.1 percent and a RevPAR of $280.71, representing a 4.5 percent increase over the prior year. This performance was bolstered by local regulatory changes affecting short-term rentals, which redirected demand toward the traditional hotel sector. Similarly, San Francisco recorded a significant recovery, with RevPAR increasing by 11.8 percent to $155.84, driven by a revitalized convention calendar and a 6.0 percent increase in ADR.
Conversely, several previously high-growth markets experienced sharp corrections. Las Vegas recorded a 10.9 percent decline in RevPAR to $149.13, a result of a 4.3 percent reduction in ADR and shifts in the city’s large-scale event schedule compared to the record-breaking 2024 cycle. Houston registered the steepest occupancy decline among major markets, falling 8.6 percent to 58.9 percent. This was attributed to a combination of high renovation activity and local labor disruptions, including a significant 40-day strike at major downtown properties during the fourth quarter. These regional fluctuations underscore the transition of the U.S. market from a period of broad-based recovery to one defined by localized economic and operational variables.
Key Performance Indicators (KPIs) — National Average (2024–2025)
| Metric | 2024 Actual | 2025 Actual | Variance (%) |
| National Occupancy (%) | 63.0 | 62.3 | -1.2 |
| Average Daily Rate (USD) | 158.67 | 160.54 | +0.9 |
| RevPAR (USD) | 99.94 | 100.02 | -0.3 |
Performance Metrics for Top 10 U.S. Markets by Absolute RevPAR (Full Year 2025)
| Market (By 2025 RevPAR) | Occupancy (%) | ADR (USD) | RevPAR (USD) | Variance (RevPAR %) |
| 1. New York City | 84.1 | 333.71 | 280.71 | +4.5 |
| 2. Maui Island | 68.2 | 395.10 | 269.46 | -2.1 |
| 3. Miami/Hialeah | 72.5 | 231.20 | 167.62 | +1.8 |
| 4. San Francisco | 68.9 | 225.82 | 155.84 | +11.8 |
| 5. San Diego | 72.4 | 212.80 | 154.07 | +1.9 |
| 6. Las Vegas | 74.5 | 199.79 | 149.13 | -10.9 |
| 7. Los Angeles | 70.8 | 204.15 | 144.54 | +1.2 |
| 8. Boston | 71.3 | 198.40 | 141.46 | -1.4 |
| 9. Washington D.C. | 66.8 | 195.20 | 130.39 | +3.4 |
| 10. Phoenix | 65.3 | 185.40 | 121.07 | -2.1 |
3. Supply and Development
The United States hotel supply grew by 1.1 percent in 2025, reaching a total of approximately 5.7 million rooms. According to Lodging Econometrics and data verified by the AHLA, the industry added 61,200 new rooms across 515 projects throughout the year. This rate of expansion remains below the long-term historical average of 2.0 percent, reflecting the continued impact of elevated construction financing costs and more stringent lending requirements from regional banks, which have traditionally been the primary financiers for hospitality development.
Brand conversions and major renovations represented a dominant share of market activity in 2025. Institutional data indicates that nearly 40 percent of “new” supply entered the market via brand changes rather than ground-up construction. This trend was particularly evident in the Upper Midscale and Upscale segments, where owners utilized property improvement plans (PIPs) to reposition assets in an environment where new-build feasibility remains challenging. Total renovation volume increased by 12 percent year-over-year, as institutional owners prioritized asset preservation and defensive capital expenditures to maintain competitiveness against newer inventory.
The forward pipeline for the 24-month period spanning 2026 and 2027 shows a moderate acceleration. As of year-end 2025, there are 6,050 projects totaling 710,000 rooms in various stages of development. Of these, 2,300 projects are currently under construction. The geographic concentration of this pipeline is heavily skewed toward the Sun Belt, with Texas, Florida, and California accounting for 35 percent of all rooms currently in the development cycle. Within these states, Dallas, Atlanta, and Nashville remain the most active sub-markets for new supply, collectively representing over 50,000 rooms in the pipeline.
Chain-scale analysis of the pipeline confirms a sustained preference for limited-service and extended-stay models. Upscale and Upper Midscale projects comprise 65 percent of the total rooms currently under construction. This concentration reflects a strategic shift toward lower-labor-intensity operating models. Conversely, Luxury development remains constrained to specific high-barrier-to-entry markets such as New York and Miami, where the feasibility of high ADRs can offset current construction and labor costs. Institutional sources note that while project abandonments have decreased from 2024 levels, the duration from ground-breaking to completion has extended by an average of four months due to localized labor shortages in the trades.
United States Hotel Development Pipeline by Construction Stage (Year-End 2025)
| Pipeline Category | Projects | Rooms |
| Under Construction | 2,300 | 275,000 |
| Starts in Next 12 Months | 2,240 | 258,000 |
| Early Planning | 1,510 | 177,000 |
| Total Pipeline | 6,050 | 710,000 |
4. Operating Environment
The operating environment for the United States hotel sector in 2025 was defined by a deceleration in labor cost growth and a stabilization of non-labor input prices. Data from the U.S. Bureau of Labor Statistics (BLS) indicates that Average Hourly Earnings for all employees in the Leisure and Hospitality sector rose by 3.8 percent in 2025. While this exceeds the 3.1 percent average wage growth across the total private sector, it represents a significant moderation from the 5.2 percent growth recorded in 2024. This cooling of the labor market is attributed to a gradual increase in the labor force participation rate and a reduction in the hospitality job opening rate, which fell from 8.1 percent in late 2024 to 6.4 percent by December 2025.
Despite the moderation in wage growth, total labor costs as a percentage of gross operating revenue remained elevated due to structural shifts in the workforce. The BLS reported a continued reliance on premium-pay overtime and contract labor in the housekeeping and culinary departments, particularly in urban markets where the unemployment rate for service-level roles remained below the national average of 3.9 percent. Furthermore, legislative changes at the state level—most notably in California and New York—resulted in targeted minimum wage increases for specific hospitality classifications, creating a localized divergence in operating margins that secondary and tertiary markets did not encounter.
Inflationary pressures on non-labor expenses trended toward the Federal Reserve’s long-term target. The Consumer Price Index (CPI) for all urban consumers ended 2025 with a 2.4 percent year-over-year increase. For hotel operators, the cost of goods sold (COGS) was influenced by a stabilization in the Producer Price Index (PPI) for processed foods and feeds, which rose by only 1.2 percent in 2025. However, the trajectory of energy costs presented a more volatile picture. The PPI for commercial electric power rose by 4.1 percent, driven by increased infrastructure investment costs passed through by regional utilities, particularly in the Northeast and Mid-Atlantic regions.
Energy costs for 2025 were also impacted by localized climate-related events and shifts in the global oil market. The U.S. Energy Information Administration (EIA) data shows that while natural gas prices remained relatively suppressed due to domestic production levels, the cost of heating oil and commercial electricity became a primary driver of increased fixed costs for northern properties. Total utility expenses as a percentage of total revenue across the U.S. hotel industry increased by an estimated 25 basis points over 2024 levels. Consequently, the combination of sustained labor costs and rising energy expenses constrained Gross Operating Profit (GOP) margins, which remained 150 basis points below 2019 levels for the full year 2025.
Annualized Percentage Change in Key Hospitality Operating Cost Indices (2024–2025)
| Operating Metric (Annual % Change) | 2024 | 2025 |
| Leisure & Hospitality Average Hourly Earnings | +5.2 | +3.8 |
| CPI – All Urban Consumers | +3.4 | +2.4 |
| PPI – Commercial Electric Power | +2.8 | +4.1 |
| PPI – Processed Foods and Feeds | +1.5 | +1.2 |
5. Outlook and Risk Factors
The outlook for the United States hotel industry for the 2026-2027 period is characterized by a projected return to fundamental growth, albeit tempered by structural shifts in guest behavior and persistent cost floors. Official national tourism forecasts from the National Travel and Tourism Office (NTTO) project a 3.4 percent increase in international inbound arrivals for 2026, driven by a normalization of visa processing times and the impact of major demand catalysts. The International Monetary Fund (IMF) World Economic Outlook aligns with this assessment, projecting a stable 1.9 percent real GDP growth rate for the U.S. in 2026, which is expected to support a steady baseline for domestic corporate and leisure travel.
Institutional sources identify the 2026 FIFA World Cup and the “America250” semiquincentennial celebrations as the principal demand catalysts for the upcoming 24-month cycle. The AHLA 2026 State of the Industry report notes that these events are projected to generate a 1.7 percent increase in total guest spending, reaching an estimated $805 billion. These catalysts are expected to be particularly impactful for the Top 25 Markets, where historical infrastructure and stadium capacities are concentrated. Consequently, forward performance indicators suggest a recovery in national occupancy levels toward the 64 percent threshold by year-end 2026, with ADR growth projected to pace at approximately 2.5 percent, finally exceeding the cooling inflation rate.
Principal risk factors remain centered on the operational and macroeconomic environment rather than a lack of demand. The IMF has documented the risk of sustained high real interest rates as a primary threat to asset valuations and the refinancing cycle for properties with debt maturing in 2026. Furthermore, the AHLA emphasizes that while labor market tightness has eased, the structural shortage of hospitality workers persists as a long-term risk to service delivery and margin preservation. Gross Operating Profit per Available Room (GOPPAR) is projected by institutional analysts to remain at approximately 90 percent of 2019 levels through 2026, as operators continue to absorb higher costs for insurance, labor, and utilities.
Official national tourism forecasts also highlight the risk of an uneven recovery in international high-spend segments. While total arrival volumes are increasing, the NTTO notes that the continued strength of the U.S. dollar against the Euro and Yen remains an institutionalized headwind for overseas visitation. Additionally, the IMF points to potential geopolitical volatility as a risk factor that could disrupt global aviation fuel prices and transatlantic travel patterns. These documented risks suggest that while the 2026 outlook is positive, the transition from a “constrained” operating environment to one of sustained profitability will depend on the effective management of expense growth and the successful capitalization on 2026 mega-events.
Institutional Growth Forecasts and Sector Performance Projections (2026)
| Forecast Indicator (2026) | Projected Value |
| Real GDP Growth (%) | 1.9 |
| International Arrivals Growth (%) | +3.4 |
| Hotel Guest Spending (USD Billions) | 805 |
| Hospitality Workforce Growth (Jobs) | +30,000 |
Available to registered members – Create an account here