
Imagine two hotels sitting across the street from each other, in the same city, targeting similar guests. On a given Tuesday night, Hotel A sells 90 of its 100 rooms. Hotel B sells only 65 of its 100 rooms. At first glance, Hotel A looks like it had the better night — more guests, more rooms filled, a fuller lobby, more towels in the laundry.
But when you look at the money each hotel actually brought in from those room sales, the picture flips. Hotel A sold its rooms at an average of $120 a night, bringing in $10,800 in room revenue. Hotel B, which sold far fewer rooms, sold them at an average of $180 a night, bringing in $11,700. Hotel B, with a quieter lobby and more empty rooms, actually generated more revenue per room available than Hotel A did.
This is the exact problem that RevPAR — Revenue Per Available Room — was created to solve. It’s one of the most widely used performance metrics in the hotel industry, and it’s built specifically to prevent the kind of misleading comparison above, where “busier” gets mistaken for “better.”
Table of Contents
What RevPAR Actually Means
RevPAR stands for Revenue Per Available Room. It’s a single number that tells you, on average, how much revenue a hotel earns from each room it has available to sell, over a given period — usually a single night, but often calculated for a week, a month, or a year.
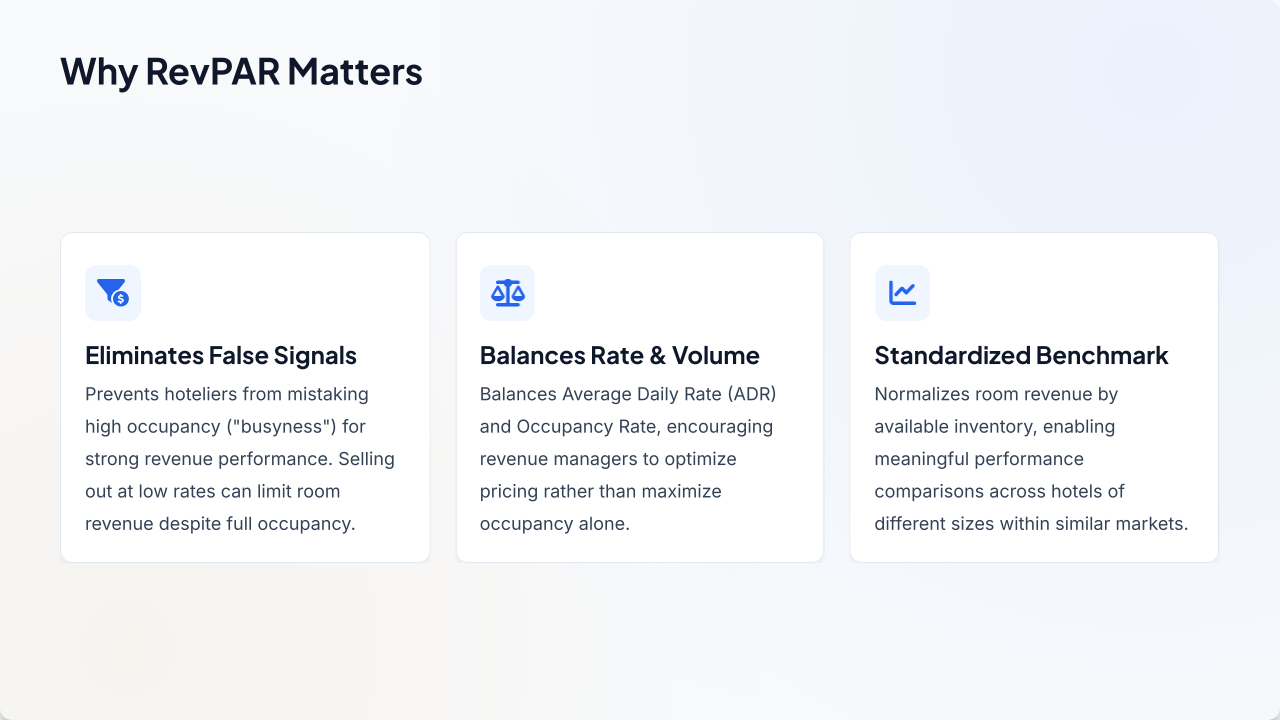
The reason RevPAR exists, rather than hotels just tracking occupancy (the percentage of rooms sold) or ADR (Average Daily Rate — the average price paid per room sold) on their own, is that each of those numbers only tells half the story. Occupancy tells you how full a hotel is, but says nothing about the price paid. ADR tells you the average price paid, but says nothing about how many rooms were actually sold. A hotel could report a fantastic ADR while sitting half-empty, or a fantastic occupancy while giving rooms away.
RevPAR combines both pieces of information into one figure, which is precisely why it’s treated as one of the most trusted indicators of how a hotel is actually performing.
There are two ways to calculate it, and they always produce the same result:
Method 1 — Multiply rate by occupancy: RevPAR = Average Daily Rate (ADR) × Occupancy Rate
Method 2 — Divide revenue by rooms: RevPAR = Total Room Revenue ÷ Total Available Rooms
Using Hotel A from the earlier example: it had an ADR of $120 and an occupancy rate of 90%. $120 × 0.90 = $108 RevPAR.
Using Hotel B: an ADR of $180 and occupancy of 65%. $180 × 0.65 = $117 RevPAR.
Or, calculated the second way: Hotel A earned $10,800 in room revenue across 100 available rooms — $10,800 ÷ 100 = $108. Hotel B earned $11,700 across 100 available rooms — $11,700 ÷ 100 = $117. Same answer either way.
Despite selling 25 fewer rooms, Hotel B outperformed Hotel A on RevPAR. That single number captures something occupancy alone would have hidden completely.
One detail worth being precise about: RevPAR only counts room revenue — the money paid specifically for the room itself. It does not include what guests spend on breakfast, the minibar, spa treatments, parking, or room service. Those categories matter to a hotel’s overall financial picture, but they’re tracked separately and folded into other metrics, which we’ll get to later in this article.
Also note that RevPAR uses available rooms as its denominator, not occupied rooms. Available rooms means every room the hotel could theoretically sell that night, whether or not it actually did, typically excluding rooms taken permanently out of inventory for renovation. This matters because it’s what makes RevPAR fair to compare across hotels of different sizes and different occupancy levels — every room the hotel owns gets counted in the denominator, whether it sold or not.
Why the Hotel Industry Built Its Business Around This Number
To understand why RevPAR matters, it helps to understand a tension that sits at the center of every hotel’s daily operation: the tug-of-war between filling rooms and charging enough for them.
A hotel could, in theory, achieve close to 100% occupancy almost every night simply by dropping its prices low enough. Rooms are a perishable product — an unsold room on a Tuesday night can never be sold again once Tuesday ends, unlike a physical product sitting on a shelf that can wait for a buyer. That perishability creates enormous pressure to sell every room, at almost any price, rather than let it go to waste.
But chasing occupancy without regard to price is a losing strategy over time. A hotel that fills every room at rock-bottom rates might look “successful” by occupancy numbers alone, while actually earning less money — and often attracting a guest profile that doesn’t match the hotel’s positioning, spends less at the bar or restaurant, and creates more wear on the property for less return.
The opposite extreme is just as risky. A hotel could set its prices very high and only sell a handful of rooms a night. Even if each of those rooms is highly profitable individually, the hotel is leaving most of its rooms empty — its single biggest asset sitting unused, earning nothing.
RevPAR exists because hotels needed one number that captures the balance between these two forces — rate and volume — rather than a hotel being praised for excelling at one while quietly losing the game on the other. It solves a real business problem: how do you know if a hotel is actually performing well, without having to weigh two separate, sometimes contradictory, numbers every time?
This is also why RevPAR became the standard language for comparing hotel performance across an entire industry. A boutique 40-room property and a 400-room convention hotel can’t be meaningfully compared by looking at total room revenue alone — the bigger hotel will almost always win simply because it has more rooms to sell. RevPAR levels that comparison, because it expresses revenue on a per-room basis, making it possible to compare hotels of completely different sizes, in different markets, on equal footing.
The Two Building Blocks Behind the Number
To really understand RevPAR, it helps to understand its two ingredients individually, since almost every conversation about improving RevPAR eventually becomes a conversation about which of these two levers to pull.
Occupancy Rate is the percentage of available rooms that were actually sold during a given period. If a hotel has 200 rooms and sells 150 of them on a given night, its occupancy rate is 150 ÷ 200 = 75%. Occupancy is influenced by demand (how many people want to stay in that city, on those dates), by the hotel’s pricing relative to competitors, and by factors like marketing, loyalty programs, and distribution — meaning how visible and bookable the hotel is across channels like its own website, OTAs (Online Travel Agencies such as Booking.com or Expedia), and travel agents.
Average Daily Rate (ADR) is the average price paid per room sold, calculated by dividing total room revenue by the number of rooms actually sold — not by the number of rooms available. If a hotel sells 150 rooms and collects $27,000 in room revenue, its ADR is $27,000 ÷ 150 = $180. Note the difference from RevPAR’s denominator: ADR only counts rooms that sold, while RevPAR’s denominator counts every room available, sold or not. This is a common point of confusion for people new to the concept, so it’s worth sitting with: two hotels can have identical ADR and completely different RevPAR, purely because one sold far more of its inventory than the other.
There’s a third factor that sits behind both occupancy and ADR without being part of the RevPAR formula itself: distribution channel mix, meaning which booking sources a hotel’s rooms actually come through. A room sold directly through the hotel’s own website typically nets the hotel more money than the same room sold through an OTA, because OTAs charge a commission — often somewhere in the range of 15% to 25% of the booking value — for the traffic and bookings they bring. Two hotels can report the exact same RevPAR while one keeps considerably more of that revenue after commissions, simply because it sells a larger share of its rooms directly rather than through third-party channels. This is why many hotels track a related figure sometimes called “net RevPAR,” which adjusts for the cost of acquiring each booking, giving a clearer sense of what the hotel actually keeps rather than what it merely collects at the front desk.
Once you understand these two components, RevPAR essentially becomes a story about trade-offs. Revenue managers — the people, often part of a hotel’s commercial or sales team, whose job is specifically to set pricing and manage inventory to maximize revenue — spend much of their time deciding, night by night and season by season, whether to prioritize rate or occupancy in order to get the best possible RevPAR.
Sometimes the right call is to hold rates high even if it costs the hotel some occupancy, because the market will still fill enough rooms at that higher price to make it worthwhile. Other times, particularly during low-demand periods, it makes more sense to lower rates enough to capture volume, since a nearly-full hotel at a modest rate can outperform a half-full hotel at a high one. There’s no fixed rule — the right balance depends on demand patterns, the competitive landscape, the season, and even the day of the week.
Seeing RevPAR at Work
Numbers become much easier to understand with a concrete situation attached to them, so let’s walk through a few realistic examples of how RevPAR shows up in a hotel’s actual operation.
Example 1: The weekday-versus-weekend swing. A 150-room business hotel located near a downtown financial district typically fills up Monday through Thursday with corporate travelers, who tend to book later and pay less price-sensitive rates because their company is footing the bill. On a typical Wednesday, the hotel might run 88% occupancy at an ADR of $210, producing a RevPAR of about $185. On Saturday, with the corporate crowd gone and only leisure travelers filling the gap, the same hotel might run just 45% occupancy at a discounted ADR of $150, producing a RevPAR of only $67.50. Seeing both numbers side by side explains, in a way occupancy or rate alone never could, why business hotels often treat weekends as their weakest revenue period and adjust everything from staffing to promotions accordingly.
Example 2: Seasonal swings at a resort. A beachfront resort might see 95% occupancy at an ADR of $400 in July (RevPAR of $380), and just 40% occupancy at an ADR of $180 in February (RevPAR of $72). This kind of gap is why resorts build entire annual budgets and staffing plans around anticipated seasonal RevPAR, rather than assuming a flat, average performance across all twelve months.
Example 3: Benchmarking against competitors. RevPAR isn’t only used to look at a single hotel in isolation — it’s also the backbone of how hotels compare themselves to their direct competitors, known in the industry as a “comp set” (competitive set), which is a group of similar hotels in the same market that a property tracks itself against. A well-known data company, STR (originally Smith Travel Research, now operating as part of CoStar), collects RevPAR and related data from thousands of hotels worldwide and produces reports that let a hotel see how its own RevPAR compares to its comp set’s average. If a hotel’s RevPAR is growing at 5% year-over-year, that might sound like good news — until the comp set report shows the overall market grew RevPAR by 9% over the same period, meaning the hotel is actually losing ground relative to its competitors, even while its own numbers technically improved.
This comparison produces another useful figure called the RevPAR Index (sometimes referred to as MPI, or Market Penetration Index), which expresses a hotel’s RevPAR as a percentage of its comp set’s average RevPAR. An index of 100 means the hotel is performing exactly at the market average. An index above 100 — say, 115 — means the hotel is outperforming its direct competitors by capturing more than its “fair share” of the market’s revenue. An index below 100 signals underperformance relative to peers, and is often one of the first numbers an owner or investor asks about when reviewing how a hotel is doing.
Example 4: A new hotel entering the market. When a brand-new hotel opens, it often can’t compete on price immediately, since it doesn’t yet have the brand recognition or guest reviews to justify premium rates. A new property might intentionally accept a lower ADR in its first year specifically to build occupancy and guest volume, accepting a modest RevPAR in the short term as an investment in market position, with the expectation that ADR — and RevPAR — will climb in later years as the hotel builds a reputation and repeat business.
Putting RevPAR to Work: How Hotels Actually Use It
Understanding what RevPAR measures is one thing; understanding how hotels use that number day to day is another. RevPAR isn’t just a report that gets generated once a month and filed away — in most hotels, it directly shapes daily pricing decisions.
Daily and even hourly pricing decisions. Most hotels today use dynamic pricing, meaning room rates change frequently — sometimes daily, sometimes multiple times a day — in response to demand signals like how many rooms remain unsold for a given date, what competitors are charging, local events, weather, and booking pace. Revenue managers (or, in smaller hotels, a general manager or owner wearing that hat) monitor projected RevPAR for upcoming dates and adjust pricing to protect or improve it. If a hotel notices that a particular Friday three weeks out is booking unusually fast, it may raise rates for that date to capture more value from the demand that’s clearly there — a strategy aimed at improving RevPAR by leaning into rate rather than giving rooms away too cheaply. Conversely, if a date is booking slowly, the hotel might lower rates to stimulate demand before that date arrives and the room’s revenue potential is lost forever.
Evaluating group and event business. When a hotel is approached to host a conference, wedding block, or corporate group — often reserving dozens or hundreds of rooms at once — the sales team has to decide whether the rate being offered for that group is worth the space it takes up. A group asking for 100 rooms at a heavily discounted rate might look attractive because it guarantees occupancy, but if it displaces individual travelers who would have paid a much higher rate for those same rooms and dates, the hotel could actually see a lower RevPAR than if it had turned the group away and sold to individual guests instead. This kind of analysis — comparing the RevPAR impact of a group booking against what the hotel could likely earn selling those rooms individually — is a routine part of how hotels decide which group business to accept.
Setting promotional and discount strategy. Hotels frequently need to decide whether a promotion (a limited-time discount, a package deal, a “book direct and save” offer) is actually good for the business, or whether it just moves revenue around without improving the underlying picture. A promotion that drives more bookings but at a much lower rate can sometimes hurt RevPAR rather than help it — the extra rooms sold don’t make up for how much rate was given away to sell them. Testing a promotion’s real impact on RevPAR, rather than just watching occupancy tick up, is a routine discipline in hotel revenue management.
Forecasting and annual budgeting. Beyond day-to-day pricing, RevPAR is central to how hotels plan further ahead. Each year, most hotels build a budget that includes a projected occupancy and ADR for every month — sometimes every day — of the coming year, based on historical performance, known events, planned renovations, and broader economic conditions. That projected occupancy and ADR combine into a budgeted RevPAR, which becomes the benchmark the hotel measures itself against all year. When actual RevPAR comes in below budget, it triggers a conversation about why — was demand in the market softer than expected, did a competitor undercut on price, did the hotel hold rates too firm during a slow stretch — and that conversation shapes decisions ranging from marketing spend to staffing levels to whether planned capital projects, like a lobby renovation, stay on schedule.
Common mistakes hotels make with RevPAR. A few patterns tend to trip up teams that are new to working with this metric.
First, treating occupancy as the goal instead of RevPAR itself. It’s intuitive to want a full hotel — a fuller hotel feels more successful, generates more energy in public spaces, and satisfies a kind of instinct that empty rooms are wasted opportunity. But as the Hotel A and Hotel B example showed earlier, a full hotel isn’t automatically a financially healthy one. Teams that chase occupancy at any cost often end up with strong-looking occupancy numbers and disappointing revenue.
Second, comparing RevPAR across time periods without accounting for seasonality or one-off events. A hotel’s RevPAR in December will naturally look different from its RevPAR in April for reasons that have nothing to do with how well the hotel is being managed — comparing month to month without context can lead to false conclusions about performance. This is part of why RevPAR is usually tracked year-over-year (this December versus last December) rather than month-over-month, in order to strip out seasonal noise.
Third, looking at RevPAR in isolation, without any reference point. A RevPAR of $150 means very little on its own — is that good or bad? It only becomes meaningful when compared to something: last year’s RevPAR for the same period, the hotel’s budgeted target, or the comp set’s average RevPAR. Isolated numbers, without context, tend to create a false sense of confidence or alarm.
What RevPAR Reveals — and What It Doesn’t
RevPAR is powerful, but it’s not the whole story of a hotel’s financial health, and understanding its limits is just as important as understanding what it measures.
The most important limitation is this: RevPAR says nothing about cost or profit. It measures revenue only — the money coming in from room sales — with no accounting for what it cost the hotel to earn that revenue. A hotel could grow its RevPAR by spending heavily on marketing, offering elaborate free amenities, or running its housekeeping staff overtime to service more rooms — all of which cost money and could shrink the hotel’s actual profit even while RevPAR climbs. This is why experienced hotel finance teams pair RevPAR with a related metric called GOPPAR — Gross Operating Profit Per Available Room — which takes the profit remaining after operating expenses (payroll, utilities, supplies, and so on) and divides it by available rooms, the same way RevPAR divides revenue. GOPPAR answers the question RevPAR can’t: after everything it cost to run the hotel, how much profit did each available room actually generate? A hotel can show rising RevPAR and falling GOPPAR at the same time, which is a warning sign that revenue growth is coming at too high a cost.
There’s also TRevPAR — Total Revenue Per Available Room — which broadens the picture in a different direction. Instead of counting only room revenue like RevPAR does, TRevPAR adds in everything else a hotel earns per available room: food and beverage sales, spa revenue, parking fees, meeting room rentals, and so on, all divided by available rooms. A hotel with a large, popular restaurant and event space might have a fairly ordinary RevPAR but an impressive TRevPAR, because so much of its revenue comes from sources beyond the room itself. Full-service hotels, resorts, and properties with strong banquet and event businesses tend to rely on TRevPAR to capture a truer picture of how much value each room generates for the business overall, since RevPAR alone would understate a property that earns heavily from its restaurant or its ballroom.
Guest experience implications. RevPAR strategy also has a direct, if less obvious, connection to how guests experience a hotel. A hotel focused heavily on maximizing occupancy might accept lower-quality bookings — guest profiles that don’t fit the property’s positioning, or groups whose needs conflict with what other guests expect — purely to fill rooms. A hotel more disciplined about protecting rate, even at the cost of some occupancy, often ends up hosting a guest mix that better matches its brand, which in turn tends to support guest satisfaction scores, online reviews, and repeat business. In this way, RevPAR strategy isn’t purely a finance conversation; it shapes who actually walks through the door.
Staffing and operational implications. RevPAR forecasts also feed directly into staffing plans. If a hotel projects a strong RevPAR week driven by high occupancy, it needs to schedule enough housekeeping, front desk, and food and beverage staff to service that volume of guests. If a hotel instead projects strong RevPAR driven by high rate but modest occupancy, its staffing needs might look quite different — fewer rooms to clean, but potentially a higher-touch guest experience to deliver at that price point. Getting this wrong in either direction creates real problems: overstaffing during a low-RevPAR period wastes payroll, while understaffing during a high-RevPAR period risks a poor guest experience precisely when the hotel is charging the most for it.
Ownership, investment, and valuation. For hotel owners, investors, and lenders, RevPAR trends are one of the first things examined when assessing how a property or a brand is performing, because RevPAR growth (or decline) over time is often treated as a proxy for the health of the broader business. Hotels are frequently bought, sold, and financed based partly on their RevPAR track record and their RevPAR trajectory relative to their market, since sustained RevPAR growth generally signals a well-run, well-positioned property, while stagnant or declining RevPAR — especially relative to a comp set that’s growing — can be an early warning sign that a hotel is losing competitiveness, whether due to physical product aging, service issues, or a shift in the local market that the hotel hasn’t adapted to.
Compensation and incentives. It’s also common for hotel management teams — particularly revenue managers and sales leaders — to have compensation or bonus structures tied at least partly to RevPAR performance, especially RevPAR growth relative to the comp set. This ties the metric directly to individual incentives, which is part of why so much attention gets paid to it inside a hotel’s operation, well beyond what a guest checking in would ever notice.
The Bottom Line
RevPAR earns its place as one of the hotel industry’s most-watched numbers because it solves a genuinely tricky problem: how do you judge a hotel’s performance when occupancy and rate can each tell a different, sometimes misleading, story on their own? By combining both into a single figure — how much revenue each available room generates, whether or not it was sold — RevPAR gives hotels, owners, and investors a fair, comparable way to measure success across different properties, seasons, and markets.
But RevPAR is a starting point, not a finish line. It tells you about revenue, not profit; about the room itself, not everything else a hotel sells; and it only means something when compared against a benchmark — last year, a budget, or a competitive set. Understanding RevPAR properly means understanding both what it captures and what it leaves out, which is exactly why hotels lean on companion metrics like GOPPAR and TRevPAR to fill in the rest of the picture.
The next time you notice a hotel offering a surprisingly good rate, or wonder why a resort’s prices swing so dramatically between seasons, you’re watching RevPAR strategy play out in real time — the constant, ongoing balancing act between filling rooms and charging what they’re actually worth.